Charts
A complete visualization consists of one or more plots and possibly other elements, such as tick marks, labels, titles and captions. In Rayon, the chart is responsible for Laying these components out visually on the space allocated to it.
Layout
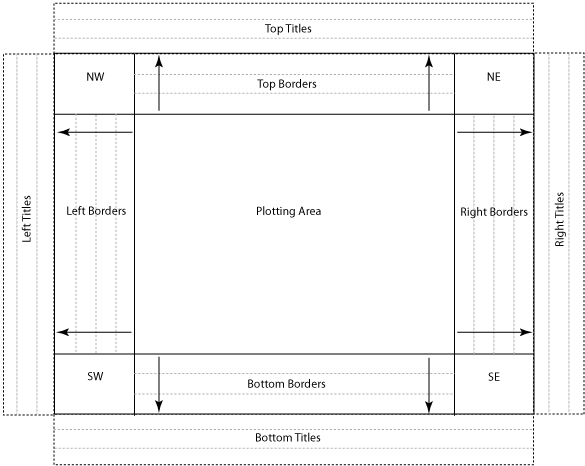
Chart layout model
Rayon charts generally divide the allotted space into borders, titles, corners and the plotting area. The plotting area and corners may contain plots, grid lines, backgrounds, foregrounds, or other chart objects. For more information on this layout model, see Charts.
Different charts lay out the plotting area in different ways. See the descriptions of the square, tiled and tiled_adv charts for details.
Padding
Items added to the plotting area or corners may be associated with padding. This reduces the effective layout area of that element in order to introduce empty space. There are four padding arguments:
- tpad indicates how much padding to add to the top of the element
- bpad indicates how much padding to add to the bottom of the element
- lpad indicates how much padding to add to the left of the element
- rpad indicates how much padding to add to the right of the element
See Specifying Size and Distance for information on the format of these arguments.
Charts
Most of the methods on chart objects concern either adding elements to the chart or accessing elements on the chart. Methods for associating elements with parts of the chart that may contain many elements (e.g., borders) begin with the prefix add_. Methods for associating elements with parts of the chart that may contain only one element (e.g., backgrounds) begin with the prefix set_. Methods for getting elements from the chart are prefixed with get_.
tiled
- toolbox.new_chart('tiled'[, num_columns, num_rows, orientation="auto"])
Subdivides the plotting area into a tiled grid with the specified number of columns and rows, and renders plots and charts into tiles in the grid. All cells have equal width and height. To control the width and height of columns and rows in the grid, use the tiled_adv chart.
num_columns, if supplied, is the number of columns in the grid. If not supplied, the grid will have as many columns as needed to tile the required number of cells into num_rows.
num_rows, if supplied, is the number of rows in the grid. If not supplied, the grid will have as many rows as needed to tile the required number of cells into num_columns.
One of num_columns or num_rows must be supplied. If both are supplied, the maximum number of cells is the product of num_columns and num_rows; attempting to add more than that will generate an error.
orientation determines the order in which cells in the grid will be filled, and must be one of the strings horizontal, vertical or auto. Horizontal tiling fills the top row first, from left to right, then the next row left-to-right, and so on until all the cells are filled or no more objects remain to be added. Vertical tiling fills the leftmost column first, from top to bottom, then the next column to the right top-to-bottom, and so on. auto indicates that vertical tiling should be used if col_weights is specified, and horizontal tiling should be used if row_weights is specified. If both col_weights and row_weights are supplied and orientation is auto, horizontal tiling will be used.
- add_bottom_border(border, height)
Adds a border to the bottom edge of the chart.
border is a Rayon border object. (See Borders.)
height is a size specification (see Specifying Size and Distance) of the border height.
This border runs from the left edge of the plot area to the right edge. To add a border that spans the whole width of the chart, see add_bottom_title.
- add_bottom_title(title_border, height)
Adds a border to the bottom edge of the chart. Unlike add_bottom_border, this border runs the entire width of the chart, and under any left or right borders the chart may have.
title_border is a Rayon border object. (See Borders.)
height is a size specification (see Specifying Size and Distance) of the border height.
- add_chart(chart[, name, <padding>])
Adds a chart object to the plotting area.
chart is the chart to add.
If supplied, name is a string that can be used later to retrieve chart from this object using get_chart.
padding represents zero or more padding arguments. (See Padding for more information on padding.)
- add_left_border(border, width)
Adds a border to the left edge of the chart.
border is a Rayon border object. (See Borders.)
width is a size specification (see Specifying Size and Distance) of the border width.
This border runs from the top edge of the plot area to the bottom edge. To add a border that spans the whole height of the chart, see add_left_title.
- add_left_title(title_border, width)
Adds a border to the left edge of the chart. Unlike add_left_border, this border runs the entire height of the chart, and to the left of any top or bottom borders the chart may have.
title_border is a Rayon border object. (See Borders.)
width is a size specification (see Specifying Size and Distance) of the border width.
- add_ne_corner(element[, <padding>])
Adds an element to the northeast corner of the chart.
element is a Rayon plot or chart.
padding represents zero or more padding arguments. (See Padding for more information on padding.)
- add_nw_corner(element[, <padding>])
Adds an element to the northwest corner of the chart.
element is a Rayon plot or chart.
padding represents zero or more padding arguments. (See Padding for more information on padding.)
- add_plot(plot : plot[, name : str, <padding>])
Adds a plot to the plotting area.
plot is the plot to add.
If supplied, name is a string that can be used later to retrieve plot from this object using get_plot.
padding represents zero or more padding arguments. (See Padding for more information on padding.)
- add_right_border(border, width)
Adds a border to the right edge of the chart.
border is a Rayon border object. (See Borders.)
width is a size specification (see Specifying Size and Distance) of the border width.
This border runs from the top edge of the plot area to the bottom edge. To add a border that spans the whole height of the chart, see add_right_title.
- add_right_title(title_border, width)
Adds a border to the right edge of the chart. Unlike add_right_border, this border runs the entire height of the chart, and to the right of any top or bottom borders the chart may have.
title_border is a Rayon border object. (See Borders.)
width is a size specification (see Specifying Size and Distance) of the border width.
- add_se_corner(element[, <padding>])
Adds element to the southeast corner of the chart.
element is a Rayon plot or chart.
padding represents zero or more padding arguments. (See Padding for more information on padding.)
- add_sw_corner(element[, <padding>])
Adds element to the southwest corner of the chart.
element is a Rayon plot or chart.
padding represents zero or more padding arguments. (See Padding for more information on padding.)
- add_top_border(border, height)
Adds a border to the top edge of the chart.
border is a Rayon border object. (See Borders.)
height is a size specification (see Specifying Size and Distance) of the border height.
This border runs from the left edge of the plot area to the right edge. To add a border that spans the whole width of the chart, see add_top_title.
- add_top_title(title_border, height)
Adds a border to the top edge of the chart. Unlike add_top_border, this border runs the entire width of the chart, and over any left or right borders the chart may have.
title_border is a Rayon border object. (See Borders.)
height is a size specification (see Specifying Size and Distance) of the border height.
- clear_padding()
Remove all padding from the chart. This does not remove the padding from the interior components of a chart, only its outer edges.
- get_chart(name) → chart
Returns a chart associated with this chart in the plotting area.
name is the name given to the associated chart when it was added using add_chart. If no chart corresponding to name is associated with this chart, this method returns None.
- get_charts() → list
Gets all chart objects associated with this chart’s plotting area.
- get_event_source(gui_event_source[, activate=True]) → event source
Creates and returns a Rayon event source that maps this chart to gui_event_source. See Events for more information on event handling in Rayon.
Note
Event handling is only implemented in interactive rendering backends. Non-interactive backends provide this function for consistency, but it does nothing.
gui_event_source is a GUI window or panel which will receive and dispatch UI events. If the backend is non-interactive, the type of event_source is unimportant.
If activate is True, Rayon event source will be created in an activated state – i.e., it will immediately begin dispatching events from event_source to the chart. If activate is False, the user must activate the event source using the source’s activate method.
- get_plot(name) → plot
Returns a plot associated with this chart in the plotting area.
name is the name given to the plot or chart when it was added using add_plot. If no plot corresponding to name is associated with this chart, this method returns None.
- get_plot_element(name) → plot or chart
Returns a plot or chart associated with this chart in the plotting area.
name is the name given to the plot or chart when it was added using add_plot. If no plot or chart corresponding to name is associated with this chart, this method returns None.
- get_plot_elements() → list
Returns a list of all chart and plot objects associated with the plotting area.
- get_plots() → list
Returns a list of all plot objects associated with the plotting area.
- set_chart_background(background)
Defines the background image or color for the entire chart. This image or color will be drawn behind any other element, and will cover the entire drawable space for the chart, including borders and titles.
background is a color specification. (See Specifying Colors.)
padding represents zero or more padding arguments. (See Padding for more information on padding.)
- set_chart_foreground(foreground)
Defines a forground image or color for the entire chart. This image or color will be drawn in front of any other element, and will cover the entire drawable space of the chart, including borders and titles. Alpha transparency is observed in both images and colors.
foreground is a color specification. (See Specifying Colors.)
padding represents zero or more padding arguments. (See Padding for more information on padding.)
- set_padding([allpad : size spec, <padding>])
Sets the amount of padding around the edges of the chart.
If specified, allpad is a single size specification (see Specifying Size and Distance). The amount of padding specified by allpad will be applied to all four edges of the canvas. The remaining arguments will be ignored.
tpad, bpad, lpad and rpad are size specifications indicating the amound of padding that should be applied to the top, bottom, left and right edges of the canvas, respectively.
- set_parent(parent)
Sets the parent of a chart to parent for the purposes of event handling in an interactive rendering backend. Does nothing if the backend is non-interactive.
- set_plot_background(background[, <padding>])
Defines a background image for the plotting area. This image or color will be drawn behind any other element.
background is either a Rayon background object or a color specification. (See Specifying Colors.)
padding represents zero or more padding arguments. (See Padding for more information on padding.)
- set_plot_foreground(foreground[, <padding>])
Defines a foreground image for the plotting area. This image or color will be drawn behind any other element. Alpha transparency is observed in both images and colors.
foreground is either a Rayon background object or a color specification. (See Specifying Colors.)
padding represents zero or more padding arguments. (See Padding for more information on padding.)
tiled_adv
- toolbox.new_chart('tiled_adv'[, col_weights : iterable, row_weights : iterable, orientation="vertical"])
Subdivides the plotting area into a tiled grid according to a set of user-supplied weights, and renders plots and charts into tiles in the grid. This chart offers the user more flexibility in creating the grid than the tiled chart, but has a more complicated interface.
If supplied, col_weights is an iterable containing the integer weights each column should have. A list [1, 1, 1] indicates three columns of equal weight; [2, 1, 1] indicates three columns, where the first (left-most) is twice as wide as the other two. If col_weights is not supplied, the grid will have as many equally-weighted columns as needed to tile the required number of cells, given the number of rows.
If supplied, row_weights is an iterable of integer weights each row should have, with the same semantics as col_weights. If not supplied, the grid will have as many equally-weighted rows as needed to tile the required number of cells, given the number of columns.
One of row_weights or col_weights must be supplied. If both are supplied, the number of rows and columns is fixed, and the maximum number of cells is the product of the number of columns and the number of rows; attempting to add more than that will generate an error.
orientation determines the order in which cells in the grid will be filled, and must be one of the strings horizontal, vertical or auto. Horizontal tiling fills the top row first, from left to right, then the next row left-to-right, and so on until all the cells are filled or no more objects remain to be added. Vertical tiling fills the leftmost column first, from top to bottom, then the next column to the right top-to-bottom, and so on. auto indicates that vertical tiling should be used if col_weights is specified, and horizontal tiling should be used if row_weights is specified. If both col_weights and row_weights are supplied and orientation is auto, horizontal tiling will be used.
- add_bottom_border(border, height)
Adds a border to the bottom edge of the chart.
border is a Rayon border object. (See Borders.)
height is a size specification (see Specifying Size and Distance) of the border height.
This border runs from the left edge of the plot area to the right edge. To add a border that spans the whole width of the chart, see add_bottom_title.
- add_bottom_title(title_border, height)
Adds a border to the bottom edge of the chart. Unlike add_bottom_border, this border runs the entire width of the chart, and under any left or right borders the chart may have.
title_border is a Rayon border object. (See Borders.)
height is a size specification (see Specifying Size and Distance) of the border height.
- add_chart(chart[, name, <padding>])
Adds a chart object to the plotting area.
chart is the chart to add.
If supplied, name is a string that can be used later to retrieve chart from this object using get_chart.
padding represents zero or more padding arguments. (See Padding for more information on padding.)
- add_left_border(border, width)
Adds a border to the left edge of the chart.
border is a Rayon border object. (See Borders.)
width is a size specification (see Specifying Size and Distance) of the border width.
This border runs from the top edge of the plot area to the bottom edge. To add a border that spans the whole height of the chart, see add_left_title.
- add_left_title(title_border, width)
Adds a border to the left edge of the chart. Unlike add_left_border, this border runs the entire height of the chart, and to the left of any top or bottom borders the chart may have.
title_border is a Rayon border object. (See Borders.)
width is a size specification (see Specifying Size and Distance) of the border width.
- add_ne_corner(element[, <padding>])
Adds an element to the northeast corner of the chart.
element is a Rayon plot or chart.
padding represents zero or more padding arguments. (See Padding for more information on padding.)
- add_nw_corner(element[, <padding>])
Adds an element to the northwest corner of the chart.
element is a Rayon plot or chart.
padding represents zero or more padding arguments. (See Padding for more information on padding.)
- add_plot(plot : plot[, name : str, <padding>])
Adds a plot to the plotting area.
plot is the plot to add.
If supplied, name is a string that can be used later to retrieve plot from this object using get_plot.
padding represents zero or more padding arguments. (See Padding for more information on padding.)
- add_right_border(border, width)
Adds a border to the right edge of the chart.
border is a Rayon border object. (See Borders.)
width is a size specification (see Specifying Size and Distance) of the border width.
This border runs from the top edge of the plot area to the bottom edge. To add a border that spans the whole height of the chart, see add_right_title.
- add_right_title(title_border, width)
Adds a border to the right edge of the chart. Unlike add_right_border, this border runs the entire height of the chart, and to the right of any top or bottom borders the chart may have.
title_border is a Rayon border object. (See Borders.)
width is a size specification (see Specifying Size and Distance) of the border width.
- add_se_corner(element[, <padding>])
Adds element to the southeast corner of the chart.
element is a Rayon plot or chart.
padding represents zero or more padding arguments. (See Padding for more information on padding.)
- add_sw_corner(element[, <padding>])
Adds element to the southwest corner of the chart.
element is a Rayon plot or chart.
padding represents zero or more padding arguments. (See Padding for more information on padding.)
- add_top_border(border, height)
Adds a border to the top edge of the chart.
border is a Rayon border object. (See Borders.)
height is a size specification (see Specifying Size and Distance) of the border height.
This border runs from the left edge of the plot area to the right edge. To add a border that spans the whole width of the chart, see add_top_title.
- add_top_title(title_border, height)
Adds a border to the top edge of the chart. Unlike add_top_border, this border runs the entire width of the chart, and over any left or right borders the chart may have.
title_border is a Rayon border object. (See Borders.)
height is a size specification (see Specifying Size and Distance) of the border height.
- clear_padding()
Remove all padding from the chart. This does not remove the padding from the interior components of a chart, only its outer edges.
- get_chart(name) → chart
Returns a chart associated with this chart in the plotting area.
name is the name given to the associated chart when it was added using add_chart. If no chart corresponding to name is associated with this chart, this method returns None.
- get_charts() → list
Gets all chart objects associated with this chart’s plotting area.
- get_event_source(gui_event_source[, activate=True]) → event source
Creates and returns a Rayon event source that maps this chart to gui_event_source. See Events for more information on event handling in Rayon.
Note
Event handling is only implemented in interactive rendering backends. Non-interactive backends provide this function for consistency, but it does nothing.
gui_event_source is a GUI window or panel which will receive and dispatch UI events. If the backend is non-interactive, the type of event_source is unimportant.
If activate is True, Rayon event source will be created in an activated state – i.e., it will immediately begin dispatching events from event_source to the chart. If activate is False, the user must activate the event source using the source’s activate method.
- get_plot(name) → plot
Returns a plot associated with this chart in the plotting area.
name is the name given to the plot or chart when it was added using add_plot. If no plot corresponding to name is associated with this chart, this method returns None.
- get_plot_element(name) → plot or chart
Returns a plot or chart associated with this chart in the plotting area.
name is the name given to the plot or chart when it was added using add_plot. If no plot or chart corresponding to name is associated with this chart, this method returns None.
- get_plot_elements() → list
Returns a list of all chart and plot objects associated with the plotting area.
- get_plots() → list
Returns a list of all plot objects associated with the plotting area.
- set_chart_background(background)
Defines the background image or color for the entire chart. This image or color will be drawn behind any other element, and will cover the entire drawable space for the chart, including borders and titles.
background is a color specification. (See Specifying Colors.)
padding represents zero or more padding arguments. (See Padding for more information on padding.)
- set_chart_foreground(foreground)
Defines a forground image or color for the entire chart. This image or color will be drawn in front of any other element, and will cover the entire drawable space of the chart, including borders and titles. Alpha transparency is observed in both images and colors.
foreground is a color specification. (See Specifying Colors.)
padding represents zero or more padding arguments. (See Padding for more information on padding.)
- set_padding([allpad : size spec, <padding>])
Sets the amount of padding around the edges of the chart.
If specified, allpad is a single size specification (see Specifying Size and Distance). The amount of padding specified by allpad will be applied to all four edges of the canvas. The remaining arguments will be ignored.
tpad, bpad, lpad and rpad are size specifications indicating the amound of padding that should be applied to the top, bottom, left and right edges of the canvas, respectively.
- set_parent(parent)
Sets the parent of a chart to parent for the purposes of event handling in an interactive rendering backend. Does nothing if the backend is non-interactive.
- set_plot_background(background[, <padding>])
Defines a background image for the plotting area. This image or color will be drawn behind any other element.
background is either a Rayon background object or a color specification. (See Specifying Colors.)
padding represents zero or more padding arguments. (See Padding for more information on padding.)
- set_plot_foreground(foreground[, <padding>])
Defines a foreground image for the plotting area. This image or color will be drawn behind any other element. Alpha transparency is observed in both images and colors.
foreground is either a Rayon background object or a color specification. (See Specifying Colors.)
padding represents zero or more padding arguments. (See Padding for more information on padding.)
square
- toolbox.new_chart('square')
Renders each plot in a series of layers, each of which has the full dimension of the plotting area. Plots will be drawn in the order in which they were added, with more recently-added ones drawn “on top”.
- add_bottom_border(border, height)
Adds a border to the bottom edge of the chart.
border is a Rayon border object. (See Borders.)
height is a size specification (see Specifying Size and Distance) of the border height.
This border runs from the left edge of the plot area to the right edge. To add a border that spans the whole width of the chart, see add_bottom_title.
- add_bottom_title(title_border, height)
Adds a border to the bottom edge of the chart. Unlike add_bottom_border, this border runs the entire width of the chart, and under any left or right borders the chart may have.
title_border is a Rayon border object. (See Borders.)
height is a size specification (see Specifying Size and Distance) of the border height.
- add_chart(chart[, name, <padding>])
Adds a chart object to the plotting area.
chart is the chart to add.
If supplied, name is a string that can be used later to retrieve chart from this object using get_chart.
padding represents zero or more padding arguments. (See Padding for more information on padding.)
- add_front_gridlines(grid[, <padding>])
Adds grid lines to the plotting area. The grid lines will appear on top of any other elements in the plotting area (except grid lines that are subsequently added with this method). Grid lines will be drawn in the order they were added to the chart, with the most recently added ones drawn on top.
grid is a Rayon grid lines object.
padding represents zero or more padding arguments. (See Padding for more information on padding.)
See also
- add_left_border(border, width)
Adds a border to the left edge of the chart.
border is a Rayon border object. (See Borders.)
width is a size specification (see Specifying Size and Distance) of the border width.
This border runs from the top edge of the plot area to the bottom edge. To add a border that spans the whole height of the chart, see add_left_title.
- add_left_title(title_border, width)
Adds a border to the left edge of the chart. Unlike add_left_border, this border runs the entire height of the chart, and to the left of any top or bottom borders the chart may have.
title_border is a Rayon border object. (See Borders.)
width is a size specification (see Specifying Size and Distance) of the border width.
- add_ne_corner(element[, <padding>])
Adds an element to the northeast corner of the chart.
element is a Rayon plot or chart.
padding represents zero or more padding arguments. (See Padding for more information on padding.)
- add_nw_corner(element[, <padding>])
Adds an element to the northwest corner of the chart.
element is a Rayon plot or chart.
padding represents zero or more padding arguments. (See Padding for more information on padding.)
- add_plot(plot : plot[, name : str, <padding>])
Adds a plot to the plotting area.
plot is the plot to add.
If supplied, name is a string that can be used later to retrieve plot from this object using get_plot.
padding represents zero or more padding arguments. (See Padding for more information on padding.)
- add_rear_gridlines(grid[, <padding>])
Adds grid lines to the plotting area. The grid lines will appear behind any other elements in the plotting area (except grid lines that have already been added with this method). Grid lines will be drawn in the order they were added to the chart, with the most recently added ones drawn on top.
grid is a Rayon grid lines object.
padding represents zero or more padding arguments. (See Padding for more information on padding.)
See also
- add_right_border(border, width)
Adds a border to the right edge of the chart.
border is a Rayon border object. (See Borders.)
width is a size specification (see Specifying Size and Distance) of the border width.
This border runs from the top edge of the plot area to the bottom edge. To add a border that spans the whole height of the chart, see add_right_title.
- add_right_title(title_border, width)
Adds a border to the right edge of the chart. Unlike add_right_border, this border runs the entire height of the chart, and to the right of any top or bottom borders the chart may have.
title_border is a Rayon border object. (See Borders.)
width is a size specification (see Specifying Size and Distance) of the border width.
- add_se_corner(element[, <padding>])
Adds element to the southeast corner of the chart.
element is a Rayon plot or chart.
padding represents zero or more padding arguments. (See Padding for more information on padding.)
- add_sw_corner(element[, <padding>])
Adds element to the southwest corner of the chart.
element is a Rayon plot or chart.
padding represents zero or more padding arguments. (See Padding for more information on padding.)
- add_top_border(border, height)
Adds a border to the top edge of the chart.
border is a Rayon border object. (See Borders.)
height is a size specification (see Specifying Size and Distance) of the border height.
This border runs from the left edge of the plot area to the right edge. To add a border that spans the whole width of the chart, see add_top_title.
- add_top_title(title_border, height)
Adds a border to the top edge of the chart. Unlike add_top_border, this border runs the entire width of the chart, and over any left or right borders the chart may have.
title_border is a Rayon border object. (See Borders.)
height is a size specification (see Specifying Size and Distance) of the border height.
- clear_padding()
Remove all padding from the chart. This does not remove the padding from the interior components of a chart, only its outer edges.
- get_chart(name) → chart
Returns a chart associated with this chart in the plotting area.
name is the name given to the associated chart when it was added using add_chart. If no chart corresponding to name is associated with this chart, this method returns None.
- get_charts() → list
Gets all chart objects associated with this chart’s plotting area.
- get_event_source(gui_event_source[, activate=True]) → event source
Creates and returns a Rayon event source that maps this chart to gui_event_source. See Events for more information on event handling in Rayon.
Note
Event handling is only implemented in interactive rendering backends. Non-interactive backends provide this function for consistency, but it does nothing.
gui_event_source is a GUI window or panel which will receive and dispatch UI events. If the backend is non-interactive, the type of event_source is unimportant.
If activate is True, Rayon event source will be created in an activated state – i.e., it will immediately begin dispatching events from event_source to the chart. If activate is False, the user must activate the event source using the source’s activate method.
- get_plot(name) → plot
Returns a plot associated with this chart in the plotting area.
name is the name given to the plot or chart when it was added using add_plot. If no plot corresponding to name is associated with this chart, this method returns None.
- get_plot_element(name) → plot or chart
Returns a plot or chart associated with this chart in the plotting area.
name is the name given to the plot or chart when it was added using add_plot. If no plot or chart corresponding to name is associated with this chart, this method returns None.
- get_plot_elements() → list
Returns a list of all chart and plot objects associated with the plotting area.
- get_plots() → list
Returns a list of all plot objects associated with the plotting area.
- set_chart_background(background)
Defines the background image or color for the entire chart. This image or color will be drawn behind any other element, and will cover the entire drawable space for the chart, including borders and titles.
background is a color specification. (See Specifying Colors.)
padding represents zero or more padding arguments. (See Padding for more information on padding.)
- set_chart_foreground(foreground)
Defines a forground image or color for the entire chart. This image or color will be drawn in front of any other element, and will cover the entire drawable space of the chart, including borders and titles. Alpha transparency is observed in both images and colors.
foreground is a color specification. (See Specifying Colors.)
padding represents zero or more padding arguments. (See Padding for more information on padding.)
- set_padding([allpad : size spec, <padding>])
Sets the amount of padding around the edges of the chart.
If specified, allpad is a single size specification (see Specifying Size and Distance). The amount of padding specified by allpad will be applied to all four edges of the canvas. The remaining arguments will be ignored.
tpad, bpad, lpad and rpad are size specifications indicating the amound of padding that should be applied to the top, bottom, left and right edges of the canvas, respectively.
- set_parent(parent)
Sets the parent of a chart to parent for the purposes of event handling in an interactive rendering backend. Does nothing if the backend is non-interactive.
- set_plot_background(background[, <padding>])
Defines a background image for the plotting area. This image or color will be drawn behind any other element.
background is either a Rayon background object or a color specification. (See Specifying Colors.)
padding represents zero or more padding arguments. (See Padding for more information on padding.)
- set_plot_foreground(foreground[, <padding>])
Defines a foreground image for the plotting area. This image or color will be drawn behind any other element. Alpha transparency is observed in both images and colors.
foreground is either a Rayon background object or a color specification. (See Specifying Colors.)
padding represents zero or more padding arguments. (See Padding for more information on padding.)
