- Background
- 1. What is SiLK?
- 2. Does SiLK support IPv6?
- 3. What platforms does SiLK run on?
- 4. What license is SiLK released under?
- 5. Something is not working as expected, where do I check for errors?
- 6. Whom do I contact for support?
- 7. How do I report a bug?
- 8. How do I contribute a patch or fix?
- 9. How do I reference SiLK in a publication?
- 10. What is the origin of the "rw" tool prefix and ".rw" file suffix?
- Configuration
- 11. What is network flow data?
- 12. What applications and hardware can generate the flows for use in SiLK?
- 13. What is the NetFlow v5 format?
- 14. What is IPFIX?
- 15. What IPFIX information elements does SiLK support?
- 16. Does SiLK support sFlow?
- 17. Why does SiLK create unidirectional flows?
- 18. Can I make it bidirectional?
- 19. I have a stack of packet capture (pcap, tcpdump) files, can I use SiLK to analyze them?
- 20. How can I process data from a Cisco ASA (Adaptive Security Appliance)?
- 21. Why is rwflowpack (or flowcap) ignoring NetFlow v9 flow records?
- 22. Why do I see the following log message in rwflowpack (or flowcap): NetFlow V9 Option Templates are NOT Supported, Flow Set was Removed.?
- 23. Why do I see the following log message in rwflowpack (or flowcap): NetFlow V9 Record Count Discrepancy. Reported: 1. Found: 15.?
- 24. Why is rwflowpack discarding the flow interfaces and Next Hop IP?
- 25. How do I configure rwflowpack to pack VLAN tags?
- 26. How many sensors does SiLK support?
- 27. Can I copy SiLK data between machines?
- 28. What ports do I need to open in a firewall?
- 29. How do I split flows seen by one flow meter into different sensors?
- 30. How do I create and use my own classes and types that can be used with a SiLK repository's storing and packing logic?
- Building and Installing
- 31. Where can I download SiLK?
- 32. Where can I find RPMs for SiLK?
- 33. What release of Python do I need if I want to use the PySiLK extension?
- 34. When I configure --with-python, I get the error message warning: Not importing directory 'site': missing __init__.py. How do I fix this?
- Operations
- 35. How long would it take to find the all the flow records to or from an IP address, when your data size is 10 billion records?
- 36. How can I improve the performance of the SiLK queries?
- 37. How are the SiLK Flow files organized and written to disk?
- 38. How many bytes does a single SiLK Flow record occupy on disk?
- 39. Where is the SiLK Flow file format documented?
- 40. What is the format of the header of a binary SiLK file?
- 41. How can I use rwsender to transfer files created by yaf?
- 42. How much disk do I need to store on a link of a particular size?
- 43. How much bandwidth will be used by rwsender?
- 44. What is the latency of the SiLK packing system?
- 45. What confidentiality and integrity properties are provided for SILK data sent across machines?
- 46. If communication between the sensor and the packer go down, are flows lost?
- 47. Can flowcap function as a "tee", both storing files and forwarding the flow stream onto some place else?
- 48. How do I list all sensors that are installed for a deployment?
- 49. How do I rotate the SiLK log files?
- Analysis
- 50. I get an error when I try to use the --python-file switch in the SiLK analysis applications. What is wrong?
- 51. Someone gave me an IPset file, and my version of the IPset tools will not read the file. What is wrong?
- 52. What do all these time switches on rwfilter do?
- 53. How do the --start-date and --end-date switches on rwfilter affect which files rwfilter examines?
- 54. Why does --type=inweb contain non-web data?
- 55. How can I make rwfilter always process incoming and outgoing data?
- 56. Why do different installations of SiLK show different timestamps and how can I fix this?
- 57. How do I import flow data into Excel?
- 58. How can I use plug-ins (or dynamic-libraries) to extend the SiLK tools?
- 59. How do I convert packet data to flows?
- 60. What is the difference between rwp2yaf2silk and rwptoflow?
- 61. I have data in some other format. How do I incorporate that into SiLK?
- 62. How do I make lists of IP addresses and label them?
- 63. How do I mate unidirectional flows to get both sides of the conversation?
- 64. I have SiLK deployed in an asymmetric routing environment, can I mate across sensors?
- 65. How can I create obfuscated (anonymized) data?
- 66. How secure is the anonymized data?
- 67. How can I produce multiple output files from a single rwfilter data pull from the repository?
- 68. How do I identify clients and servers from source-IP and destination-IP?
- 69. How do I identify FTP traffic?
- 70. How do I use Graphviz to visualize associations?
- 71. How do I use gnuplot with rwcount's output?
Background
- ↥ 1. What is SiLK?
-
SiLK is a suite of network traffic collection and analysis tools developed and maintained by the CERT Network Situational Awareness Team (CERT NetSA) at Carnegie Mellon University to facilitate security analysis of large networks. The SiLK tool suite supports the efficient collection, storage, and analysis of network flow data, enabling network security analysts to rapidly query large historical traffic data sets.
- ↥ 2. Does SiLK support IPv6?
-
As of SiLK 3.0.0, IPv6 support is available in most of the SiLK tool suite, including in IPsets, Bags, and Prefix Maps. To process, store, and query IPv6 flow records, SiLK must be configured for IPv6 by specifying the --enable-ipv6 switch to the configure script when you are building SiLK. See the Installation Handbook for details. Note the following:
- rwaddrcount will not be modified to support IPv6, since rwuniq provides similar functionality.
- rwptoflow will not be modified to support IPv6, since rwp2yaf2silk provides similar functionality.
- rwrandomizeip does not yet support IPv6.
- rwscan and rwscanquery do not yet support IPv6.
- rwtotal will not be modified to support IPv6, since rwuniq provides similar functionality.
- num2dot does not yet support IPv6.
- ↥ 3. What platforms does SiLK run on?
-
SiLK should run on most UNIX-like operating systems. It is most heavily tested on Linux, Solaris, and Mac OS X.
- ↥ 4. What license is SiLK released under?
-
Copyright 2025 Carnegie Mellon University.
NO WARRANTY. THIS CARNEGIE MELLON UNIVERSITY AND SOFTWARE ENGINEERING INSTITUTE MATERIAL IS FURNISHED ON AN "AS-IS" BASIS. CARNEGIE MELLON UNIVERSITY MAKES NO WARRANTIES OF ANY KIND, EITHER EXPRESSED OR IMPLIED, AS TO ANY MATTER INCLUDING, BUT NOT LIMITED TO, WARRANTY OF FITNESS FOR PURPOSE OR MERCHANTABILITY, EXCLUSIVITY, OR RESULTS OBTAINED FROM USE OF THE MATERIAL. CARNEGIE MELLON UNIVERSITY DOES NOT MAKE ANY WARRANTY OF ANY KIND WITH RESPECT TO FREEDOM FROM PATENT, TRADEMARK, OR COPYRIGHT INFRINGEMENT.
Licensed under a GNU GPL 2.0-style license, please see license.html or contact permission@sei.cmu.edu for full terms.
[DISTRIBUTION STATEMENT A] This material has been approved for public release and unlimited distribution. Please see Copyright notice for non-US Government use and distribution.
This Software includes and/or makes use of Third-Party Software each subject to its own license.
DM25-091
- ↥ 5. Something is not working as expected, where do I check for errors?
-
The applications that make up the packing system (flowcap, rwflowpack, rwflowappend, rwsender, and rwreceiver) write error messages to log files. The location of these log files is set when the daemon is started, with the default location being
/usr/local/var/silk.All other applications write error messages to the standard error (stderr).
- ↥ 6. Whom do I contact for support?
-
Your primary support person should be the person or group that installs and maintains SiLK at your site. You may also send email to
 .
.
In Spring 2014, the netsa-tools-discuss public mailing list was created for questions about and discussion of the NetSA tools. You may subscribe and read the archives from here.
- ↥ 7. How do I report a bug?
-
If some behavior in SiLK is different than what you expect, please write an email specifying what you did, what happened, and how that differed from what you expected. Send your email to
.
The following pieces of information may help us to diagnose the issue, and we ask that you please include them in your bug report.
- The exact command that caused the problem. If the failing tool is part of UNIX pipe (e.g., rwfilter ... | rwuniq ...), please include the entire command since the bug may be caused by something happening upstream. You may obfuscate IP addresses or sensor names in the command, but please let us know that you have modified the command.
- The complete error message you receive.
- For daemons (rwflowpack, rwsender, rwreceiver, flowcap, rwflowappend, rwpollexec), please include the relevant portions of the log file or syslog entries. If the behavior is repeatable, getting it to happen while using the "debug" log-level may give additional information.
- If the error is related to data collection in rwflowpack or flowcap, please include the portions of the sensor.conf file related to the probe or sensor that is causing problems. You may obfuscate IP addresses. Also, please mention the version of the libfixbuf library you are using.
- The version of the tool that is causing the bug. You can determine this by running TOOL --version, e.g., rwfilter --version. Include the entire output so will we know what optional features the tool may be using.
- If you cannot run TOOL --version or it exits without printing anything, send the output of ldd TOOL (or the ldd equivalent on your operating system).
- If you cannot build the tool, the version of SiLK you are attempting to install and the complete error message that make gives you.
-
If the configure script fails, include the
config.logfile, which includes additional information as to why configure failed. - If the command is reading SiLK data files, the output of running rwfileinfo on those files may be helpful.
- The operating system you are using (for example, the distribution of Linux and its version)
You can help us help you by writing an effective bug report.
- ↥ 8. How do I contribute a patch or fix?
-
We welcome bug fixes and patches. You may send them to
.
- ↥ 9. How do I reference SiLK in a publication?
-
The BibTeX entry format would be:
@MISC{SiLK,
 author = "{CERT/NetSA at Carnegie Mellon University}",
 title = "{SiLK (System for Internet-Level Knowledge)}",
 howpublished = "[Online]. Available:
    \url{http://tools.netsa.cert.org/silk}.",
 note = "[Accessed: July 13, 2009]"}
Update the "Accessed" date to the day you accessed the SiLK website, and then you can cite the software in a LaTeX document using
\cite{SiLK}.The final output should look like this:
CERT/NetSA at Carnegie Mellon University. SiLK (System for Internet-Level Knowledge). [Online]. Available: http://tools.netsa.cert.org/silk. [Accessed: July 13, 2009].
- ↥ 10. What is the origin of the "rw" tool prefix and ".rw" file suffix?
-
In the very early days of the project that would eventually become known as SiLK, the researchers experimented with storing ("packing") and analyzing three types of data. Tools were written to pack and analyze each data type in similar ways, but the packed files had different formats and the tools were specific to each format, with a two-letter prefix distinguishing each type (two letters because the principle investigator, Dr. Suresh L. Konda, wanted to minimizing typing).
- The td prefix indicated tools whose data originated from tcpdump (pcap) data: tdflowpack, tdfilter, tdcut.
- The gw prefix indicated tools whose data originated from gateway data---logs for protocol-specific information (HTTP, DNS): gwflowpack, gwfilter, gwcut.
- The rw prefix indicated tools whose data originated from raw NetFlow v5 data: rwflowpack, rwfilter, rwcut.
The NetFlow approach was a success and the other approaches were abandoned. There was no formal name for the project, and the developers and analysts would refer to the tools collectively as the "rw-tools".
With the unexpected passing of Suresh, the tool suite was renamed SiLK in his honor. At the time it seemed too disruptive to rename the tools and the "rw" prefix remained.
Initially the "rw" prefix was only used for tools that worked with flow records; for example, tools working with IPset files were named setcat and setunion. Later we decided to use the "rw" prefix for (nearly) all the tools to identify them as part of the same suite.
Using .rw as a file suffix to denote a file generated by the rw-tools and containing SiLK records originated with analysts and spread to others.
Configuration
- ↥ 11. What is network flow data?
-
(Taken from Chapter 2 of the SiLK Analysts' Handbook .) NetFlow is a traffic-summarization format that was first implemented by Cisco Systems, primarily for billing purposes. Network flow data (or Network flow) is a generalization of NetFlow.
Network flow collection differs from direct packet capture, such as tcpdump, in that it builds a summary of communications between sources and destinations on a network. This summary covers all traffic matching seven particular keys that are relevant for addressing: the source and destination IP addresses, the source and destination ports, the protocol type, the type of service, and the interface on the router. We use five of these attributes to constitute the flow label in SiLK: the source and destination addresses, the source and destination ports, and the protocol. These attributes (sometimes called the 5-tuple), together with the start time of each network flow, distinguish network flows from each other.
A network flow often covers multiple packets, which are grouped together under a common flow label. A flow record thus provides the label and statistics on the packets that the network flow covers, including the number of packets covered by the flow, the total number of bytes, and the duration and timing of those packets. Because network flow is a summary of traffic, it does not contain packet payload data.
- ↥ 12. What applications and hardware can generate the flows for use in SiLK?
-
SiLK accepts flows in the NetFlow v5 format from a router. These flows are sometimes called Protocol Data Units (PDU). You can also find software that will generate NetFlow v5 records from various types of input.
When compiled with libfixbuf support, SiLK can accept NetFlow v9, flows in the IPFIX (Internet Protocol Flow Information eXport) format, and sFlow v5 records. You can use the yaf flow meter to generate IPFIX flows from libpcap (tcpdump) data or by live capture.
- ↥ 13. What is the NetFlow v5 format?
-
The definition of NetFlow v5 format is available in the following tables copied from Cisco (October 2009). A NetFlow v5 packet has a 24 byte header and up to thirty 48 byte records. The maximum NetFlow v5 packet is 1464 bytes. The NetFlow v5 header and record formats are specified in the following tables. The record table also lists the SiLK field name, where applicable, but note that SiLK packs the fields differently than NetFlow.
Count Contents Octet
PositionOctet
LengthDescription 1 version 0-1 2 NetFlow export format version number 2 count 2-3 2 Number of flows exported in this packet (1-30) 3 SysUptime 4-7 4 Current time in milliseconds since the export device booted 4 unix_secs 8-11 4 Current count of seconds since 0000 UTC 1970 5 unix_nsecs 12-15 4 Residual nanoseconds since 0000 UTC 1970 6 flow_sequence 16-19 4 Sequence counter of total flows seen 7 engine_type 20 1 Type of flow-switching engine 8 engine_id 21 1 Slot number of the flow-switching engine 9 sampling_interval 22-23 2 First two bits hold the sampling mode; remaining 14 bits hold value of sampling interval Count Contents Octet
PositionOctet
LengthDescription SiLK Field 1 srcaddr 0-3 4 Source IP address sIP 2 dstaddr 4-7 4 Destination IP address dIP 3 nexthop 8-11 4 IP address of next hop router nhIP 4 input 12-13 2 SNMP index of input interface in 5 output 14-15 2 SNMP index of output interface out 6 dPkts 16-19 4 Packets in the flow packets 7 dOctets 20-23 4 Total number of Layer 3 bytes in the packets of the flow bytes 8 First 24-27 4 SysUptime at start of flow sTime 9 Last 28-31 4 SysUptime at the time the last packet of the flow was received eTime 10 srcport 32-33 2 TCP/UDP source port number or equivalent sPort 11 dstport 34-35 2 TCP/UDP destination port number or equivalent dPort 12 pad1 36 1 Unused (zero) bytes - 13 tcp_flags 37 1 Cumulative OR of TCP flags flags 14 prot 38 1 IP protocol type (for example, TCP = 6; UDP = 17) protocol 15 tos 39 1 IP type of service (ToS) n/a 16 src_as 40-41 2 Autonomous system number of the source, either origin or peer n/a 17 dst_as 42-43 2 Autonomous system number of the destination, either origin or peer n/a 18 src_mask 44 1 Source address prefix mask bits n/a 19 dst_mask 45 1 Destination address prefix mask bits n/a 20 pad2 46-47 2 Unused (zero) bytes - - ↥ 14. What is IPFIX?
-
IPFIX is the Internet Protocol Flow Information eXport format. Based on the NetFlow v9 format from CISCO, IPFIX is the draft IETF standard for representing flow data. The rwipfix2silk and rwsilk2ipfix programs in SiLK---which are available when SiLK has been configured with libfixbuf support---will convert between the SiLK Flow format and the IPFIX format.
- ↥ 15. What IPFIX information elements does SiLK support?
-
For input, the IPFIX information elements supported by SiLK are listed in the following table. (The SiLK tools that read IPFIX are flowcap, rwflowpack, and rwipfix2silk.) Elements marked with "(P)" are defined in CERT's Private Enterprise space, PEN 6871. The third column denotes whether the element is reversible. Internally, SiLK stores flow duration instead of end time.
IPFIX information elements read by SiLK IPFIX Element (ID) IE Length
(octets)Rev SiLK Field octetDeltaCount (1)
octetTotalCount (85)
initiatorOctets (231)
responderOctets (232)
8
8
8
8R
R
bytes packetDeltaCount (2)
packetTotalCount (86)
initiatorPackets (298)
responderPackets (299)8
8
8
8R
R
packets protocolIdentifier (4) 1 protocol tcpControlBits (6) 1 R flags sourceTransportPort (7) 2 sPort sourceIPv4Address (8)
sourceIPv6Address (27)4
16sIP ingressInterface (10)
vlanId (58)4
2
Rin destinationTransportPort (11) 2 dPort destinationIPv4Address (12)
destinationIPv6Address (28)4
16dIP egressInterface (14)
postVlanId (59)4
2
Rout ipNextHopIPv4Address (15)
ipNextHopIPv6Address (62)4
16nhIP flowEndSysUpTime (21)
flowEndSeconds (151)
flowEndMilliseconds (153)
flowEndMicroseconds (155)
flowEndDeltaMicroseconds (159)
flowDurationMilliseconds (161)
flowDurationMicroseconds (162)4
4
8
8
4
4
4duration flowStartSysUpTime (22)
flowStartSeconds (150)
flowStartMilliseconds (152)
flowStartMicroseconds (154)
flowStartDeltaMicroseconds (158)
systemInitTimeMilliseconds (160)
reverseFlowDeltaMilliseconds (P, 21)4
4
8
8
4
8
4sTime flowEndReason (136)
silkTCPState (P, 32)
flowAttributes (P, 40)1
1
2
Rattributes initialTCPFlags (P, 14) 1 R initialFlags unionTCPFlags (P, 15) 1 R sessionFlags silkFlowType (P, 30) 1 class & type silkFlowSensor (P, 31) 2 sensor silkAppLabel (P, 33) 2 application On output, rwsilk2ipfix writes the IPFIX information elements specified in the following table when producing IPFIX from SiLK flow records. The output includes both IPv4 and IPv6 addresses, but only one set of IP addresses will contain valid values; the other set will contain only 0s. Elements marked "(P)" are defined in CERT's Private Enterprise space, PEN 6871.
IPFIX information elements written by SiLK Count SiLK Field IPFIX Element (ID) IE Length
(Octets)Octet
Position1 sTime flowStartMilliseconds (152) 8 0-7 2 sTime + duration flowEndMilliseconds (153) 8 8-15 3 sIP sourceIPv6Address (27) 16 16-31 4 dIP destinationIPv6Address (28) 16 32-47 5 sIP sourceIPv4Address (8) 4 48-51 6 dIP destinationIPv4Address (12) 4 52-55 7 sPort sourceTransportPort (7) 2 56-57 8 dPort destinationTransportPort (11) 2 58-59 9 nhIP ipNextHopIPv4Address (15) 4 60-63 10 nhIP ipNextHopIPv6Address (62) 16 64-79 11 in ingressInterface (10) 4 80-83 12 out egressInterface (14) 4 84-87 13 packets packetDeltaCount (2) 8 88-95 14 bytes octetDeltaCount (1) 8 96-103 15 protocol protocolIdentifier (4) 1 104 16 class & type silkFlowType (P, 30) 1 105 17 sensor silkFlowSensor (P, 31) 2 106-107 18 flags tcpControlBits (6) 1 108 19 initialFlags initialTCPFlags (P, 14) 1 109 20 sessionFlags unionTCPFlags (P, 15) 1 110 21 attributes silkTCPState (P, 32) 1 111 22 application silkAppLabel (P, 33) 2 112-113 23 - paddingOctets (210) 6 114-119 - ↥ 16. Does SiLK support sFlow?
-
Support for sFlow v5 is available as of SiLK 3.9.0 when you configure and build SiLK to use v1.6.0 or later of the libfixbuf library.
- ↥ 17. Why does SiLK create unidirectional flows?
-
SiLK's origins are in processing NetFlow v5 data, which is unidirectional. Changing SiLK to support bidirectional flows would be major change to the software. Even if SiLK supported bidirectional flows, you would still face the task of mating flows, since a site with many access points to the Internet will often display asymmetric routing (where each half of a conversion passes through different border routers).
- ↥ 18. Can I make it bidirectional?
-
No, SiLK does not support bidirectional flows. You will need to mate the unidirectional flows, as described in the FAQ entry How do I mate unidirectional flows to get both sides of the conversation?.
- ↥ 19. I have a stack of packet capture (pcap, tcpdump) files, can I use SiLK to analyze them?
-
Yes you can. Please see the answer to How do I convert packet data (pcap) to flows?.
- ↥ 20. How can I process data from a Cisco ASA (Adaptive Security Appliance)?
-
When configuring rwflowpack or flowcap to capture data from a Cisco ASA, you must include a
quirksstatement in the probe block of thesensor.conffile. Thequirksstatement must includefirewall-eventandzero-packets, as shown in this example probe:probe S20 netflow-v9 listen-on-port 9988 protocol udp quirks firewall-event zero-packets end probeThere are several things to keep in mind when analyzing flow records that originated from a Cisco ASA.
- The NetFlow v9 templates do not include an IE that gives the TCP flags for the record, and the flags field is always empty.
-
The NetFlow v9 templates used by many ASAs do not include an
information element (IE) that provides the number of packets in the
flow record. Normally SiLK would treat these records as having a
packet count of 0, but the
zero-packetsquirk causes SiLK to set packet count to 1 for these flow records. -
The IEs exported by the ASA that SiLK uses for the bytes field are
different that what SiLK traditionally expects. The bytes field in
SiLK is based on the
dOctetsfield in the NetFlow v5 record. This field counts the number of Layer 3 octets which includes IP headers and IP payload. (The IPFIX version of this field is octetDeltaCount, IE#1.) The ASA exports initiatorOctets and responderOctets (IE#231 and IE#232), which count only Layer 4 (payload) bytes. It is possible for the ASA to create a flow record that has a byte count of zero (consider a SYN packet to a closed port). As of SiLK 3.11.0, SiLK sets the byte count of such a record to 1. (Previous releases of SiLK ignored these records.)
- ↥ 21. Why is rwflowpack (or flowcap) ignoring NetFlow v9 flow records?
-
There are a variety of reasons that rwflowpack (or flowcap) may fail to receive NetFlow v9 flow records, and since NetFlow v9 uses UDP (which is a connectionless protocol), problems receiving NetFlow v9 can be hard to diagnose. Here are potential issues and solutions, from the minor to the substantial:
-
In the
sensor.conffile for rwflowpack, you may have configured the probe asnetflow, which is an alias fornetflow-v5. You must usenetflow-v9for rwflowpack to accept NetFlow v9 flow records. - Your firewall may be blocking the packets. Check the settings of your firewall (e.g., iptables) to ensure the router may connect to the host and port where rwflowpack is listening.
-
Your router may sending the records to a host or port other
the one where rwflowpack is listening.
Ensure the
listen-on-portandlisten-as-hostvalues in thesensor.conffile for rwflowpack match theip flow-exportvalues you used when you configured the router. -
There may an IPv4/IPv6 mismatch between the address where
rwflowpack is listening and the destination
used by the router. For best results, use an IP address in
the
listen-as-hostsetting insensor.confand theip flow-exportsetting in the router. -
Perhaps you being affected by the template timeout. NetFlow
v9 and IPFIX are template based, where a template describes
the flow records. SiLK (via libfixbuf) cannot process the
data stream until it has seen the templates (the data stream
is just "random" data until libfixbuf has seen the template
that describes it). For an IPFIX session over TCP, the
templates are sent at the beginning of the session, and
libfixbuf can process the data stream immediately. For UDP,
the templates are sent periodically by the router, and when
the router is started before rwflowpack,
rwflowpack ignores the data until the router
resends the templates. (The data is not entirely ignored:
there may be error messages in rwflowpack's
log regarding "No Template Present for Domain".) For some
devices the resend timeout is large, and you may want to
reduce it using the
template data timeoutsetting of the router. - You may be using a Cisco ASA router. See the answer to this question to configure rwflowpack or flowcap to receive data from an ASA.
-
In the
- ↥ 22. Why do I see the following log message in rwflowpack (or flowcap): NetFlow V9 Option Templates are NOT Supported, Flow Set was Removed.?
-
This message occurs when using a version of libfixbuf that does not have support for NetFlow v9 Option Templates. As of libfixbuf-1.4.0, NetFlow v9 Option Templates and Records are collected and translated to IPFIX.
- ↥ 23. Why do I see the following log message in rwflowpack (or flowcap): NetFlow V9 Record Count Discrepancy. Reported: 1. Found: 15.?
-
The likely cause for these messages is that the flow generator is putting the number of FlowSets into the NetFlow v9 message header. According to RFC 3954, the message header is supposed to contain the number of Flow Records, not FlowSets.
Other than being a nuisance in the log file, the messages are harmless. The NetFlow v9 processing library, libfixbuf, processes the entire packet, and it is reading all the flow records despite the header having an incorrect count.
The messages are generated by libfixbuf. Currently the only way to suppress the messages is by disabling all warnings from libfixbuf, which you may do by setting the SILK_LIBFIXBUF_SUPPRESS_WARNINGS environment variable to 1 prior to starting rwflowpack or flowcap.
- ↥ 24. Why is rwflowpack discarding the flow interfaces and Next Hop IP?
-
In our experience, the flow interfaces (or SNMP interfaces, ifIndex values) and the Next Hop IP do not provide much useful information for security analysis, and by default SiLK does not include them in our packed data files. If you wish to store these values or use them for debugging your packing configuration, you can instruct rwflowpack to store the SNMP interfaces and Next Hop IP by giving the it the --pack-interfaces switch. If you are using the
rwflowpack.conffile, set thePACK_INTERFACESvalue to 1 and restart rwflowpack. The change will be noticeable once rwflowpack creates new hourly files, since flow records that are appended to existing files use the format of that file. - ↥ 25. How do I configure rwflowpack to pack VLAN tags?
-
The SiLK flow collection tools rwflowpack and flowcap can either store the router's SNMP interface values or VLAN tags, and they store the values in the
inandoutfields of a SiLK Flow record. By default, the SNMP values are stored. To store VLAN values instead, modify each of theprobeblocks in the sensor.conf file, adding aninterface-valuesstatement as shown here:probe SENSOR1 ipfix interface-values vlan listen-on-port 18001 protocol tcp accept-from-host 127.0.0.1 end probeAfter that change, the
internal-interfacesandexternal-interfacesstatements in thesensorblocks of the sensor.conf file reference the VLAN ids.Finally, add the --pack-interfaces switch to the rwflowpack command line to have it store the VLAN ids in the hourly files. (If using the
rwflowpack.conffile, set thePACK_INTERFACESvariable to one:
PACK_INTERFACES=1.Restart rwflowpack if necessary.
Newly collected data will contain the VLAN ids in the
inandoutfields. The fields' value is zero when no VLAN id was present. When using rwfilter, use the --input-index and --output-index switches to partition records by the VLAN ids. - ↥ 26. How many sensors does SiLK support?
-
The SiLK Flow format is capable of representing 65534 unique sensors.
- ↥ 27. Can I copy SiLK data between machines?
-
Yes, a binary file produced by a SiLK application will store its format, version, byte order, and compression method near the beginning of the file (in the file's header). (You can use the rwfileinfo tool to get a description of the contents of the file's header.) Any release of SiLK that understands that file version should be able to read the file. However, note that if the file's data is compressed, the SiLK tools on the second machine must have been compiled with support for that compression library. The SiLK tools will print an error and exit if they are unable to read a file because the tool does not understand the file's format, version, or compression method.
- ↥ 28. What ports do I need to open in a firewall?
-
SiLK does not use any hard-coded ports. All SiLK tools that do network communication (flowcap, rwflowpack, rwsender, and rwreceiver) have some way to specify which ports to use for communication.
When flowcap or rwflowpack collect flows from a router, you will need to open a port for UDP traffic between the router and the collection machine.
When flowcap or rwflowpack collect flows from a yaf sensor running on a different machine, you will need to open a port for TCP (or SCTP) traffic between these two machines.
Finally, when you are using flowcap on remote sensor(s) that feed data to rwflowpack running on a central data repository, you will need to open a port between each sensor and your repository. Configure flowcap or rwsender on the sensor and rwflowpack or rwreceiver on repository to use that port.
See the tools' manual pages and the Installation Handbook for details on specifying ports.
- ↥ 29. How do I split flows seen by one flow meter into different sensors?
-
In the rwflowpack configuration file sensor.conf, a flow collection point is called a probe. In that file, you may have two sensor blocks process data collected by a single probe.
You may want to use the
discard-whenordiscard-unlesskeywords to avoid storing duplicate flow records for each sensor, as shown in the Single Source Becoming Multiple Sensors example configuration. - ↥ 30. How do I create and use my own classes and types that can be used with a SiLK repository's storing and packing logic?
-
The classes and types in SiLK are defined in the
silk.confconfiguration file. Adding a new type to that file allows all of analysis tools in SiLK to know that that type is valid.For that type to be populated with flow records, you need to have rwflowpack categorize records as that type and store those records in the data repository so rwfilter can find them. The code that categorizes flow records is called the packing logic, and packing logic is normally loaded into rwflowpack as a plug-in.
SiLK uses the term site to denote the combination of a
silk.conffile and a packing logic plug-in. The SiLK source code has two sites named generic and twoway.While you may modify one of these sites, we suggest that you create a new site for your customization so that your changes are not overwritten when you update your SiLK installation.
Since you must write C code, creating a new type in SiLK takes a fair amount of effort. It is not necessarily difficult, but there are several details to handle.
The following uses
silkto denote the top-level directory of the SiLK source code and$prefixto denote the directory where SiLK is installed.There are four major steps to customizing SiLK's packing logic: (A) Create a site, (B) modify the
silk.conffile, (C) modify the packing logic C code, and (D) build and install SiLK.-
Create a site (this step may be skipped).
-
To create a new site named enhanced, create a directory
silk/site/enhanced. Copy the files from thesilk/site/twowaydirectory into thesilk/site/enhanceddirectory, and then, for each file in that directory, replace all instances oftwowaywithenhanced. -
To integrate the
site/enhanceddirectory into the build system, you must have these utilities installed (version shown is the minimum supported): -
Go into the top-level silk directory and run
autoreconf -fiv. That command should regenerate
the
silk/site/enhanced/Makefile.infile and thesilk/configurescript.
-
To create a new site named enhanced, create a directory
-
Modify the
silk.conffile.-
Next you need to modify the
silk.conffile. Assuming you have created the enhanced site, opensilk/site/enhanced/silk.confin a text editor. - If you choose to create a new site, you may delete all the existing types and start clean. If you are modifying the twoway or generic site and you have existing data to want to maintain access to, you should only add new types.
-
Each type is defined with a type statement
inside a class block. A sample type
statement is
type 2 inweb iw
where- The first argument is the numeric ID that is stored on each flow record associated with this type; that ID must be unique across all class/type pairs within a site. (These values may be displayed by specifying --fields=id-flowtype to the rwsiteinfo utility.)
- The second argument is the type name used in SiLK's interface. Each type name must be unique within a class.
- The final (optional) argument is the prefix given to these files in the data repository, and it is the flowtype name. When this argument is not specified, the flowtype name is created by joining the class name and the type name. (These values are displayed by specifying --fields=flowtype to rwsiteinfo.)
- The default-types statement in that block tells rwfilter which types to select when the user does not specify any on rwfilter's command line. Update that statement as you desire.
-
The packing-logic statement specifies the name of
the plug-in that rwflowpack should load. If you
did a global replace of
twowaywithenhanced, it should saypacking-logic "packlogic-enhanced.so"
-
Once you have made your changes, save the
silk.conffile. -
To test that the syntax of this file is correct, you can use the
rwsiteinfo tool and use its
--site-configuration switch to specify the location of
the
silk.conffile you modified.
-
Next you need to modify the
-
Modify the packing logic C file.
-
To modify the packing logic, open the
silk/site/enhanced/packlogic-enhanced.cfile in a code editor. -
If the goal of your change is to add types similar to the
inweb and outweb types, create a
macro or a function that determines whether a SiLK Flow record
meets your criteria. For example, if you want to store DNS data
in the types indns and outdns,
you may use the macro
#define RWREC_IS_DNS(r) \ ((6 == rwRecGetProto(r) || 17 == rwRecGetProto(r)) \ && (53 == rwRecGetSPort(r) || 53 == rwRecGetDPort(r))) -
To make the packing logic easier to follow, we recommend
#define-ing macros that reflect the numeric values of the types you defined in Step B.3, such as#define RW_IN_WEB 2
-
Depending on what you are trying to accomplish with your packing
logic, you may want to define additional networks. A
network is a name that reflects a set of IP addresses or
SNMP interfaces. The IPs or interfaces for a network are
specified in the
sensor.conffile, and the packing logic code compares the record's values to those specified for the network. The values of theNETWORK_macros and the names in thenet_names[]array must be in agreement. -
The
filetypeFormats[]array reflects the fact that sometimes flow records for a class/type pair use a specific data file format. The number of entries in that array must be equal to the number types you defined in thesilk.conffile. The values in the array are ignored when SiLK is compiled with IPv6 support. -
Part of the job of the
packLogicSetup()function is to ensure that packing logic plug-in loaded by rwflowpack is in agreement with thesilk.conffile. For each type in Steps B.3 and C.3, there should be a statement similar toFT_ASSERT(RW_IN_WEB, "inweb");
That statement causes rwflowpack to exit with an error if the numeric ID of theinwebtype from thesilk.conffile is not 2. -
The
FT_ASSERTmacro assumes the class of the data is all. If you define a new class, you will need to replaceFT_ASSERT()with a call tosksiteFlowtypeAssert(). -
The
packLogicSetup()function also ensures thatfiletypeFormats[]array contains the correct number of entries. If your configuration is going to require additional information (say from an external file), thepackLogicSetup()function is the best place to load or set that information. -
The
packLogicTeardown()function is used to clean-up any state or memory that the plug-in owns. -
The job of the
packLogicVerifySensor()function is to ensure that the packing logic code has everything it needs to work correctly by verifying that the user specified the correct values in thesensor.conffile. The function returns 0 to denote okay and non-zero for error. Whether you need to make changes to this function depends on the changes you make elsewhere in the file and how much checking of users' input you wish to do. -
The meat of the packing logic is defined in the
packLogicDetermineFlowtype()function. The function is called on an individual record,rwrec, that was collected atprobe. The function must fill theftypesandsensoridsarrays with the numeric flowtype(s) and numeric sensor ID(s) into which the flow record should be categorized, and it returns the number of entries it added to each array.
Examine the code in thepackLogicDetermineFlowtype()function in both the twoway and generic sites to see examples of how that function is used. The helper functions that start with skpc are defined in the C files in thesilk/src/libflowsourcedirectory. -
The
packLogicDetermineFileFormat()function specifies the file format to use when rwflowpack writes the record to disk. Typically no changes will be required to this function. -
Save the
packlogic-enhanced.cfile.
-
To modify the packing logic, open the
-
Build and install
-
Run the new configure script you created in Step
A.3 and verify that the
silk/site/enhanced/Makefilefile is created. - Run make to compile your code.
- Run make install to install the code.
-
You should be able to run
$prefix/sbin/rwflowpack \
    --site-conf=$prefix/share/silk/enhanced-silk.conf
to test the loading of your packing logic. -
If necessary, update the
sensor.conffile to define and use the new networks you defined in Step C.4. - Use the instructions in the SiLK Installation Handbook as a guide for configuring and running rwflowpack.
-
Run the new configure script you created in Step
A.3 and verify that the
-
Create a site (this step may be skipped).
Building and Installing
- ↥ 31. Where can I download SiLK?
-
The latest Open Source version of SiLK and selected previous releases are available from http://tools.netsa.cert.org/silk/download.html.
- ↥ 32. Where can I find RPMs for SiLK?
-
Because there are many configuration options for SiLK, we recommend that you build your own RPMs as described for SiLK 3.23 and later or the older method described in the "Create RPMs" section of the SiLK Installation Handbook.
Since SiLK 3.23.2, RPMs for SiLK (and other NetSA tools) for Red Hat Enterprise Linux 9 and RHEL 8 are available from our Yum repository. These RPMS are built with with IPv6, GnuTLS, fixbuf, PySiLK, Snappy, and MaxMind (since 3.23.4) support enabled.
- ↥ 33. What release of Python do I need if I want to use the PySiLK extension?
-
The PySiLK extension requires Python 2.4 or later, and Python 2.6 or later is highly recommended. PySiLK is known to work with Python releases up to Python 3.7.
- ↥ 34. When I configure --with-python, I get the error message warning: Not importing directory 'site': missing __init__.py. How do I fix this?
-
This error message occurs because Python is attempting to treat the site directory in the SiLK source tree as a Python module directory. This happens when you are running Python >= 2.5, and the PYTHONPATH environment variable includes the current working directory. Examples of PYTHONPATH values that can cause this error are when the value begins or ends with a colon (':') or if any element of the value is a single period ('.').
The solution to this problem is to either unset the PYTHONPATH before running configure, or to ensure that all references to the current working directory are removed from PYTHONPATH before running configure.
Operations
- ↥ 35. How long would it take to find the all the flow records to or from an IP address, when your data size is 10 billion records?
-
This is a difficult question to answer, because there are so many variables that will affect the results.
On a beefy machine, rwfilter was invoked using the --any-addr switch to look for a /16 (IPv4-only). rwfilter was told only to print the number of records that matched---rwfilter did not produce any other output. Therefore, the times below are only for scanning the input.
rwfilter was invoked with --threads=12 to query a data store of 3260 files that contained 12.886 billion IPv4 records, and rwfilter took 19:18 minutes to run the query. That corresponds to a scan rate of 11.1 million records per second, or 0.927 million records per thread per second.
When the query was run a second time, rwfilter completed in 6:28 minutes, or 2.76 million records per thread per second. This machine has a large disk cache which is why the second run was so much faster than the first.
For another run, rwfilter was run with a single thread to query 4996 files that contained 3.27 billion IPv4 records, and rwfilter completed the query in 9:10 minutes. That is a scan rate of 5.95 million records second, which would require approximately 28 minutes to scan 10 billion records.
As seen in this simple example, there are many things that can affect performance. Some items that will affect the run time are:
- The speed of your processors and your disks, and how many other tasks they are performing.
- Whether the files being queried are in the machine's disk cache or are being read "cold".
- The number of threads you tell rwfilter to use. Additional threads can speed rwfilter's processing time, but at some point you reach the point of diminishing returns. When we first tested the threading in rwfilter several years ago, we found a sweet spot of about three threads per processor (before the days of commodity multi-core processors).
- The source of the input. In these test runs, there were a few thousand files to process, and the threading in rwfilter was able to assign the input files to the different threads. If the input was coming from a single source, rwfilter would run in single threaded mode.
- How much output rwfilter produces. These test runs only told the number of matching records, but you probably want to output those flow records for further analysis. Consider the two extremes: When the IP address you are searching for does not match any records, the performance of rwfilter will be similar to these test runs. When the IP address matches every record, rwfilter must write all the input records to its output. Producing output will slow rwfilter in two ways: the first is in writing bytes to the output, the second is that there is more thread contention as they vie for the output stream mutex.
- ↥ 36. How can I improve the performance of the SiLK queries?
-
As analysts, it seems we spend a lot of time waiting for rwfilter to pull data from the repository. One way to reduce the wait time is to write efficient queries. Here are some good practices to follow:
-
Only look at the files that have the data you are interested in.
- Specify the hour to the --start-date and --end-date switches to reduce the time window.
- If traffic for the IPs you are interested in normally passes through particular border routers, use the --sensor switch to limit your search to those sensors.
- Limit the query to the relevant class(es) and type(s). For example, when looking at DNS traffic you do not need the web traffic, so specify --type=in or --type=out to eliminate the web traffic from your data pull.
- Instead of repeating the same rwfilter command multiple times and piping the results to different applications, save the rwfilter results to a local file, and use the file as input to the different applications.
-
Rather than querying the same time range multiple times with
slightly different parameters, consolidate the query into a
single rwfilter invocation, and then split the
result. For example:
-
Instead of issuing two rwfilter commands to pull
TCP and then UDP traffic, pull both protocols at once and
then split the result:
$ rwfilter --protocol=6,17 --pass=temp.rw ...
$ rwfilter --proto=6 --pass=tcp.rw --fail=udp.rw temp.rw
-
If you want to pull data for a set of IP addresses, build
an IPset with rwsetbuild, and use
one of the set switches on rwfilter:
$ rwsetbuild myips.txt myset.set
$ rwfilter ... --dipset=myset.set
-
Instead of issuing two rwfilter commands to pull
TCP and then UDP traffic, pull both protocols at once and
then split the result:
-
Take advantage of additional filtering options for your
initial pull to restrict the query to the traffic of interest.
- You can use country code and protocol to restrict the traffic in a coarse grain way--i.e., cast a sufficiently broad net so you don't have to re-issue queries for the same time period.
- If you are only interested in completed TCP connections, you can filter using TCP flags (e.g., --flags-initial) and byte and packet counts (e.g., flows with more than 5 packets --packets=5-).
- Outgoing traffic is always smaller than incoming, due to incoming scan traffic. If you are looking at TCP traffic and you just need evidence of communication, consider specifying the outgoing types (--type=out,outweb) rather than incoming.
- Instead of using IPsets, consider using the --tuple options to rwfilter. The tuple options allow you to search both directions at once and to limit your search to traffic between particular IP addresses and/or particular ports.
- Sometimes it is easier to specify what you don't need. Use the --fail switch on rwfilter to select the flows that don't match the partitioning parameters.
-
Only look at the files that have the data you are interested in.
- ↥ 37. How are the SiLK Flow files organized and written to disk?
-
SiLK Flows are stored in binary files, where each file corresponds to unique class-type-sensor-hour tuple. Multiple data repositories may exist on a machine; however, rwfilter is only capable of examining a single data repository per invocation.
A default repository location is compiled into rwfilter. (This default is set by the --enable-data-rootdir=DIR switch to configure and defaults to
/data). You may tell rwfilter to use a different repository by setting the SILK_DATA_ROOTDIR environment variable or specifying the --data-rootdir switch to rwfilter.The structure of the directory tree beneath the root is determined by the path-format entry in the
silk.conffile for each data repository. Traditionally, the directory structure has been /DATA_ROOTDIR/class/type/year/month/day/hourly-files - ↥ 38. How many bytes does a single SiLK Flow record occupy on disk?
-
A fully-expanded, uncompressed, SiLK Flow record requires 52 bytes (this is 88 bytes for IPv6 records). These records are written by rwcat --compression=none.
Records in the SiLK data repository require less space since common attributes (sensor, class, type, hour) are stored once in the file's header. The smallest record (uncompressed) in the data repository is that representing a web flow which requires only 22 bytes.
In addition, one can enable data compression in an individual SiLK application (with the --compression-method switch) or in all SiLK applications when SiLK is configured (specify the --enable-output-compression switch when you invoke the configure script). Compression with the
lzo1xalgorithm reduces the overall file size by about 50%. Usingzlibgives a better compression ratio, but the at the cost of access time.The rwfileinfo command will tell you the (uncompressed) size of records in a SiLK file.
- ↥ 39. Where is the SiLK Flow file format documented?
-
SiLK uses many different file formats: There are file formats for IPsets, for Bags, for Prefix Maps, and for SiLK Flow records. The files that contain SiLK Flow records come in several different formats as well, where the differences include whether
- the sensor and class/type information is stored on every record or in the file's header
- the records support the additional flow information that yaf provides
- the records contain the next hop IP and the router's input and output interface numbers
- the file contains only flow records on ports 80/tcp, 443/tcp, and 8080/tcp
In addition to various file and record formats, the records in a file may be stored in big endian or little endian byte order. Finally, groups of flow records may be written as a block, where the block is compressed with the zlib or LZO compression libraries.
The recommended way to put one or more files of SiLK Flow records into a known format is to use the rwcat tool. The rwcat command to use is:
rwcat --compression=none --byte-order=big [--ipv4-output] FILE1 FILE2 ...That command will produce an output stream/file having a standard SiLK header followed by 0 or more records in the format given in the following table. The length of the SiLK header is the same as the size of the records in the file.
When SiLK is not compiled with IPv6 support or the --ipv4-output switch is given, each record will be 52 bytes long, and the header is 52 bytes; otherwise each record is 88 bytes and the file's header is 88 bytes.
The other SiLK Flow file formats are only documented in the comments of the source files. See the
rw*io.cfiles in thesilk/src/libsilkdirectory.IPv4 Bytes IPv6 Bytes Field Description 0-7 0-7 sTime Flow start time as milliseconds since UNIX epoch 8-11 8-11 duration Duration of flow in milliseconds (allows for a 49 day flow) 12-13 12-13 sPort Source port 14-15 14-15 dPort Destination port 16 16 protocol IP protocol 17 17 class,type Class & Type (Flowtype) value as set by SiLK packer (integer to name mapping determined by silk.conf) 18-19 18-19 sensor Sensor ID as set by SiLK packer (integer to name mapping determined by silk.conf) 20 20 flags Cumulative OR of all TCP flags (NetFlow flags) 21 21 initialFlags TCP flags in first packet or blank 22 22 sessionFlags Cumulative OR of TCP flags on all but initial packet or blank 23 23 attributes Specifies various attributes of the flow record 24-25 24-25 application Guess as to the content the flow. Some software that generates flow records from packet data, such as yaf, will inspect the contents of the packets that make up a flow and use traffic signatures to label the content of the flow. The application is the port number that is traditionally used for that type of traffic (see the /etc/servicesfile on most UNIX systems).26-27 26-27 n/a Unused 28-29 28-29 in Router incoming SNMP interface 30-31 30-31 out Router outgoing SNMP interface 32-35 32-35 packets Count of packets in the flow 36-39 36-39 bytes Count of bytes on all packets in the flow 40-43 40-55 sIP Source IP 44-47 56-71 dIP Destination IP 48-51 72-87 nhIP Router Next Hop IP - ↥ 40. What is the format of the header of a binary SiLK file?
-
Every binary file produced by SiLK (including flow files, IPsets, Bags) begins with a header describing the contents of the file. The header information can be displayed using the rwfileinfo utility. The remainder of this entry describes the binary header that has existed since SiLK 1.0. (This FAQ entry does not apply to the output of rwsilk2ipfix, which is an IPFIX stream.)
The header begins with 16 bytes that have well-defined values. (All values that appear in the header are in network byte order; the header is not compressed.)
Offset Length Field Description 0 4 Magic Number A value to identify the file as a SiLK binary file. The SiLK magic number is 0xDEADBEEF. 4 1 File Flags Bit flags describing the file. Currently one flag exists: The least significant bit will be high if the data section of the file is encoded in network (big endian) byte order, and it will be low if the data is little endian. 5 1 Record Format The format of the data section of the file; i.e., the type of data that this file contains. This will be one of the fileOutputFormatsvalues defined in thesilk_files.hheader file. For a file containing IPv4 records produced by rwcat, the value is 0x16 (decimal 22, FT_RWGENERIC). For an IPv6 file, the value is 0x0C, (decimal 12, FT_RWIPV6ROUTING).6 1 File Version This describes the overall format of the file, and it is always 0x10 (decimal 16) for any file produced by SiLK 1.0 or later. (The version of the records in the file is at byte offset 14.) 7 1 Compression This value describes how the data section of the file is compressed. 0 SK_COMPMETHOD_NONE no compression 1 SK_COMPMETHOD_ZLIB libz (gzip) using default compression level 2 SK_COMPMETHOD_LZO1X lzo1x() method from LZO 8 4 SiLK Version The version of SiLK that produced this file. This value is computed by transforming a SiLK version, X.Y.Z, as X*1,000,000 + Y*1,000 + Z. For SiLK 1.2.3, the value is 1,002,003. 12 2 Record Size Number of bytes required per record in this file. This is 52 (0x0034) for the current version of FT_RWGENERIC records, and 88 (0x0058) for the current version of FT_RWIPV6ROUTING records. For some files, this value is unused and it is set to 1. 14 2 Record Version The version of the record format used in this file. Currently this is 5 for FT_RWGENERIC records and 1 for FT_RWIPV6ROUTING records. Following those 16 bytes are one or more variable-length header entries; each header entry begins with two 4 bytes values: the header entry's identifier and the byte length of the header entry (this length includes the two 4 byte values). The content of the header entry follows those 8 bytes. Currently there is no restriction that a header entry begin at a particular offset. The following header entries exist:
ID Length Description 0 variable This is the final header entry, and it marks the end of the header. Every SiLK binary file contains this header entry immediately before the data section of the file. The length of this header entry will include padding so that the size of the complete file header is an integer multiple of the record size. Any padding bytes will be set to 0x00. 1 24 Used by the hourly files located in the data store ( /data). This entry contains the starting hour, flowtype, and sensor for the records in that file.2 variable Contains an invocation line, like those captured by rwfilter. This header entry may appear multiple times. 3 variable Contains an annotation that was created using the --notes-add switch on several tools. This header entry may appear multiple times. 4 variable Used by flowcap to store the name of the probe where flow records were collected. 5 variable Used by prefix map files to record the map-name. 6 16 Used by Bag files (e.g. rwbag) to store the key type, key length, value type, and value length of the entries. 7 32 Used by some IPset files (e.g. rwset) to describe the structure of the tree that contains the IP addresses. The minimum SiLK header is 24 bytes: 16 bytes of well-defined values followed by the end-of-header header entry containing no padding.
rwcat will remove all header entries from a file and leave only the end-of-header header entry, which will padded so that the entire SILK header is either 52 bytes for IPv4 (FT_RWGENERIC) files or 88 bytes for IPv6 (FT_RWIPV6ROUTING) files.
- ↥ 41. How can I use rwsender to transfer files created by yaf?
-
The rwsender and rwreceiver daemons are indifferent to the types of files they transfer. However, you must ensure that files are added to rwsender's incoming-directory in accordance with SiLK's directory polling logic.
The SiLK daemons that use directory polling (including rwsender) treat any file whose name does not begin with a dot and whose size is non-zero as a potential candidate for processing. To become an actual candidate for processing, the file must have the same size as on the previous directory poll. Once the file becomes an actual candidate for processing, the daemon will not notice if the file's size and/or timestamp changes.
To work with directory polling, SiLK daemons that write files normally create a zero length placeholder file, create a working file whose name begins with a dot followed by the name of the placeholder file, write the data into the working file, and replace the placeholder file with the working file once writing is complete.
Any process that follows a similar procedure will interoperate correctly with SiLK. Any that does not risks having its files removed out from under it.
The yaf daemon does not follow this procedure; instead, it uses
.lockfiles. When yaf is invoked with the --lock switch, it creates aflows.yaf.lockfile while it is writing data toflows.yaf, and yaf removesflows.yaf.lockonce it closesflows.yaf.For yaf and rwsender to interoperate correctly, an intermediate process is required. The suggested process is the filedaemon program that comes as part of the
libairframelibrary that is bundled with yaf. filedaemon supports the.lockextension, and it can move the completed files from yaf's output directory to rwsender's incoming directory. The important parts of tool chain resemble:Tell yaf to use the
.locksuffix, and rotate files every 900 seconds:yaf --out /var/yaf/output/foo --lock --rotate 900 ...
Have filedaemon watch that directory, respect
*.lockfiles, move the files it processes to/var/rwsender/incoming, and run the "no-op" command/bin/trueon those files:filedaemon --in '/var/yaf/output/foo*yaf' --lock \ --next /var/rwsender/incoming ... \ -- /bin/trueTell rwsender to watch filedaemon's next directory:
rwsender --incoming-directory /var/rwsender/incoming ...
- ↥ 42. How much disk do I need to store a link of a particular size?
-
There are many factors that determine the amount of space required, including (1) the size of the link being monitored, (2) the link's utilization, (3) the type of traffic being collected and stored (NetFlow-v5, IPFIX-IPv4, or IPFIX-IPv6), (4) the amount of legacy data to store, and (5) the number of flows records generated from the data. The SiLK Provisioning Spreadsheet allows one to see how modifying the first four factors affects the disk space required. (The spreadsheet specifies a value for the fifth factor based on our experience.)
- ↥ 43. How much bandwidth will be used by rwsender?
-
The factors that affect the bandwidth required by rwsender to transfer to the storage center flows collected by a flowcap daemon running near a sensor are nearly identical to those that determine the amount of disk space required (see previous entry). The SiLK Provisioning Spreadsheet includes bandwidth calculations.
- ↥ 44. What is the latency of the SiLK packing system?
-
The latency of the packing system (the time from a flow being collected to it being available for analysis in the SiLK data repository) depends on how the packing system has been configured and additional factors. It can be a few seconds for a simple configuration or a few minutes for a complex one.
Before the SiLK packing system sees the flow record, the act of generating a flow record itself involves latency. For a long-lived connection (e.g., ssh), the flow generator (a router or yaf) may generate the flow record 30 minutes after the first packets for that session were seen. The active timeout is defined as amount of time a flow generator waits before creating a flow record for an active connection.As described in the SiLK Installation Handbook, there are numerous ways the SiLK packing system can be configured. The latency will depend on the number of steps in your particular collection system.
- rwflowpack only
- flowcap to rwsender/rwreceiver to rwflowpack
- rwflowpack to rwsender/rwreceiver to rwflowappend
- flowcap to rwsender/rwreceiver to rwflowpack to rwsender/rwreceiver to rwflowappend
For each type of configuration, we give a summary, a table itemizing the contributions to the total, and an explanation of those numbers.
- rwflowpack only
-
Latency: typically small, but up to 120 seconds
Description Min Max rwflowpack buffering 0 120 TOTAL 0 120 For a configuration where rwflowpack collects the flow records itself and packs them directly into the data repository, the latency is typically small, but with the default settings it can be as large as two minutes: As rwflowpack creates SiLK records, it buffers them in memory until it has a 64kb block of them, and then writes that block to disk. (The buffering improves performance since there is less interaction with the disk. When compression is enabled, the 64kb blocks can provide for better overall compression.)
If the flow collector is monitoring a busy link, flows arrive quickly and the 64kb buffers will fill quickly and be written to disk, making the latency small. However, on a less-busy link, the buffers will be slower to fill. In addition, depending on the flow collector's active timeout setting, the flow collector may generate flow records that have a start time in the previous hour. These flows become less frequent as time passes, slowing the rate that the 64kb buffers associated with the previous hour's files are filled.
To make certain that flows reach the disk in a timely fashion and to reduce the number of flows that would potentially be lost due to a sudden shutdown of rwflowpack, rwflowpack flushes all its open files every so often. By default, this occurs every 120 seconds. The default can be changed by specifying the --flush-timeout switch on the rwflowpack command line.
If a flow arrives just before rwflowpack flushes the file, it will appear almost instantly, so the minimum latency is 0 seconds. A flow arriving just after the files are flushed could be delayed by 120 seconds.
- flowcap to rwsender/rwreceiver to rwflowpack
-
Latency: 30 seconds to 255 seconds or more
Description Min Max flowcap accumulation 0 60 rwsender directory polling 15 30 waiting for other files to be sent 0 d1 rwsender transmission to rwreceiver 0 15 rwflowpack directory polling 15 30 waiting for other files to be packed 0 d2 rwflowpack buffering 0 120 TOTAL 30 255 + d1 + d2 When flowcap is added to the collection configuration, the latency will be larger. In this configuration, flowcap is used to collect the flows from the flow generator, an rwsender/rwreceiver pair moves the flows from flowcap to rwflowpack, and rwflowpack packs the flows and writes them to the data repository.
- flowcap
-
Once the flow collector generates the flow record, it should arrive at flowcap in negligible time. flowcap accumulates the flows into files for transport to a packing location. The files are released to rwsender once they reach a particular size or after a certain amount of time, whichever occurs first. By default, the timeout is 60 seconds; it can be specified with the --timeout switch on the flowcap command line. Decreasing the timeout has two effects:
- Each file has a small header (less than 100 bytes) describing the file. As the file size becomes smaller, the overhead due to the header increases.
- Many small files can adversely affect rwsender, as described below.
- rwsender and rwreceiver
-
Once flowcap releases the file of accumulated flows, it gets moved to a directory being monitored by an rwsender process. rwsender checks this directory every 15 seconds (by default) to see what files are present. (Specify the --polling-interval switch to change the setting from the default.) If a file's size has not changed since the previous check, rwsender will accept the file for sending to an rwreceiver process. In the best case, a file will be accepted in just over 15 seconds; in the worst case, it can take up to 30 seconds before the file is accepted. In addition, if the directory has a large number of files (a few thousand), the time to scan the directory and determine the size of each file will add measurable overhead to each rwsender directory poll.
Files in the rwsender queue may not be sent immediately if other files are backlogged, but that number is hard to quantify, so we define it as the delay d1. Under most circumstances, we expect this to be a few seconds at most.
Transmission of a file from rwsender to rwreceiver can be relatively quick if the network lag is low, or slow if there is high network lag. This time is hard to determine without empirical data, and it will vary as the load on the network varies. We do not have any hard data, but our past experiences on our networks say that most files from flowcap make it from rwsender to rwreceiver in less than 15 seconds.
The rwsender process may be configured to send its data to multiple rwreceivers. Although these transfers can happen simultaneously, they may add latency:
- the increase in traffic from sending to multiple rwreceivers can add load to the network
- the increase in disk I/O may can add load to the system
- the additional thread(s) may add some small overhead
The administrator can also configure rwsender to prioritize files by filename. For example, if certain sensors contain more time-sensitive (important) data, they can be set to a higher priority. This will cause these files to "jump the queue" over other files, and it will increase the delay of the lower priority files.
- rwflowpack
-
After the file has arrived at rwreceiver, the file is handed off to rwflowpack via another round of directory polling. The same issues exist here that exist for rwsender:
- It will take two directory scans (up to 30 seconds) for rwflowpack to decide that the file is ready for processing.
- A large number of files will slow the directory scan.
- Once accepted, the file could sit in rwflowpack's queue waiting for other files to be processed. We will call this delay d2.
When a single rwflowpack process is packing files from multiple flowcap processes, the directory scan overhead can become large. In addition, the value of d2 is much harder to quantify, as it is an aggregation point from multiple sensors.
Finally, there is the latency associated with rwflowpack itself, as described in the previous section.
- The "flooding" problem:
- Under most circumstances, the values d1 and d2 should be no more than few seconds. If part of the system goes down (aside from the flow generator or flowcap, which are injecting flows into the system), or if the network between rwsender and rwreceiver becomes disconnected, the two directory polling locations can act as accumulation points, where the files will pile up (as behind a dam). Once the system is brought back up or the network connection is re-established, the resulting flood can drastically increase d1 and/or d2 and affect downstream latency for all sensors.
- rwflowpack to rwsender/rwreceiver to rwflowappend
-
Latency: 30 seconds to 195 seconds or more
Description Min Max rwflowpack accumulation 0 120 rwsender directory polling 15 30 waiting for other files to be sent 0 d3 rwsender transmission to rwreceiver 0 15 rwflowappend directory polling 15 30 waiting for other files to be written 0 d4 TOTAL 30 195 + d3 + d4 Some configurations of the SiLK packing system do not use rwflowpack to write to the data repository, but instead use an rwsender/rwreceiver pair between rwflowpack and another tool that writes the SiLK flows to the data repository: rwflowappend.
In this configuration, rwflowpack collects the flows directly from the flow generator (yaf or a router) and writes the flow records to small files called "incremental" files. After some time, rwflowpack releases the incremental files to an rwsender process. rwflowpack's --flush-timeout switch controls this time, and the default is 120 seconds.
The issues that were detailed above in for rwsender/rwreceiver exist here as well, and this rwsender process is more likely to experience the issues related to handling many small files. We call time that rwsender holds the files prior to transferring to rwreceiver delay d3. The network transfer from rwsender to one or more rwreceiver processes was discussed above, and although this value is hard to quantify and can vary, we will again use 15 seconds for this delay.
rwreceiver places the incremental files into a directory that rwflowappend polls. This could add an additional 30 seconds. The time that rwflowappend holds the files prior to processing them is hard to quantify; we use d4 for this value.
Once rwflowappend begins to process an incremental file, it writes its contents to the appropriate data file in the repository, and then closes the repository file. There should be very little time required for this operation.
- flowcap to rwsender/rwreceiver to rwflowpack to rwsender/rwreceiver to rwflowappend
-
Latency: 60 seconds to 330 seconds or more
Description Min Max flowcap accumulation 0 60 rwsender directory polling 15 30 waiting for other files to be sent 0 d1 rwsender transmission to rwreceiver 0 15 rwflowpack directory polling 15 30 waiting for other files to be packed 0 d2 rwflowpack accumulation 0 120 directory polling by rwsender 15 30 waiting for other files to be sent 0 d3 rwsender transmission to rwreceiver 0 15 rwflowappend directory polling 15 30 waiting for other files to be written 0 d4 TOTAL 60 330 + d1 + d2 + d3 + d4 For this configuration, we combine the analysis of the previous two configurations. One item to note: Since rwflowpack splits the flows it receives from flowcap into files based on the flowtype (class/type pair) and the hour, a single file rwflowpack receives from flowcap can generate many incremental files to be sent to rwflowappend.
This configuration is also subject to the "flooding" problem when processing is restarted after a stoppage.
- ↥ 45. What confidentiality and integrity properties are provided for SILK data sent across machines?
-
The rwsender and rwreceiver programs can use GnuTLS to provide a secure layer over a reliable transport layer. For this support to be available, SiLK's configure script must have found v2.12.0 or later of the GnuTLS library. Using GnuTLS also requires creating certificates, which is described in an appendix of the Installation Handbook.
We recommend creating a local certificate authority (CA) file, and creating program-specific certificates signed by that local CA. The local CA and program-specific certificates are copied onto the machines where rwsender and rwreceiver are running. The local CA acts as a shared secret: it is on both machines and it is used to verify the asymmetric keys between the rwsender and rwreceiver certificates.
If someone else has access to the local CA, they would not be able to decipher the conversation, since the conversation is encrypted with a private key that was negotiated during the initialization of the TLS session.
However, anyone with access to the CA would be able to set up a new session with an rwsender (to download files) or an rwreceiver (to spoof files). The certificates should be one part of your security; additional measures (such as firewall rules) should be enabled to mitigate these issues.
When GnuTLS is not used or not available, communication between rwsender and rwreceiver has no confidentiality or integrity checking beyond that provided by standard TCP.
Legacy systems that use a direct connection between flowcap and rwflowpack have no confidentiality or integrity checking beyond that provided by standard TCP, and there is no way to secure this communication without using some outside method (such as creating an ssh tunnel).
- ↥ 46. If communication between the sensor and the packer go down, are flows lost?
-
It depends on what you mean by "sensor". If the "sensor" is the flow generator (that is, a router or an IPFIX sensor) which is communicating directly with rwflowpack, the flows are lost when the connection goes down.
To avoid this, you can run flowcap on the sensor. flowcap acts as a flow capacitor, storing flows on the sensor until the communication link between the sensor and packer is restored. Flows will still be lost if the connection between the flow generator and flowcap goes down, but by running flowcap on a machine near the flow generator (or running both on the same machine), the communication between the generator and flowcap should be more reliable, leading to fewer dropped connections.
- ↥ 47. Can flowcap function as a "tee", both storing files and forwarding the flow stream onto some place else?
-
The flowcap program cannot do this itself; however, the rwsender program can send files to multiple rwreceivers. To get the "tee" functionality, have flowcap drop its files into a directory for processing by rwsender.
- ↥ 48. How do I list all sensors that are installed for a deployment?
-
The rwsiteinfo command will print information about your site's configuration. To list the sensors and their desciptions, run rwsiteinfo --fields=sensor,describe-sensor.
- ↥ 49. How do I rotate the SiLK log files?
-
If you invoke a SiLK daemon with the --log-destination=syslog switch, the daemon will use the syslog(3) command to write log messages, and syslog will manage log rotation.
If you pass the --log-directory switch to a daemon, the daemon will manage the log files itself. The first message received after midnight local time will cause the daemon to close the current log file, compress it, and open a new log file.
Analysis
- ↥ 50. I get an error when I try to use the --python-file switch in the SiLK analysis applications. What is wrong?
-
PySiLK support involves loading several shared object files, and a misconfiguration can cause PySiLK support to be unavailable. There are several issues that may cause problems when using the --python-file switch.
- Make certain the application has PySiLK support. PySiLK support is only available in the following applications: rwfilter, rwcut, rwgroup, rwsort, rwstats, and rwuniq. Note that PySiLK support in rwgroup and rwstats did not exist prior to SiLK 2.0.
-
Make certain that you compiled SiLK with Python support. To
determine if PySiLK support is available, run the command
rwcut --version | grep -i pysilk.
- If the output includes a directory path, PySiLK support was included when you built SiLK. Continue to the next item.
-
If you get the value
PySiLK support: no, Python support was not included in your build of SiLK. To get PySiLK support, you need to reconfigure and rebuild SiLK.
-
Determine whether the application is able to load the
silkpython.soplug-in file, which is normally installed in the$prefix/lib/silk/directory. Run rwcut --help | grep python-file.-
If there is output from the command,
silkpython.sois being properly loaded and you can go to the next item. -
If there is no output, there is a problem loading the
plug-in. To debug the issue, first check to see if other
plug-ins are available by running rwcut
--plugin=flowrate.so --help | grep payload-rate. If
you get output, the problem is limited to PySiLK. Perhaps
you need to set the LD_LIBRARY_PATH environment variable
to include the location of the Python library
(libpython2.so or similar). If you do not get output,
there is probably an issue loading all SiLK plug-ins. You
may need to set SILK_PATH or set LD_LIBRARY_PATH to
include the directory
$prefix/lib/silk/. To help debug the issue, you can try running SILK_PLUGIN_DEBUG=1 rwcut --version.
-
If there is output from the command,
-
Determine whether the error is in your Python script. Run the
command rwcut --python-file=/dev/null --help.
- If you get the error rwcut: Could not load the "silk.plugin" python module, you need to set the PYTHONPATH environment variable to the location specified by the command shown in (1).
- If that works, the problem is in your Python file. You may want to set the SILK_PYTHON_TRACEBACK environment variable to get more debugging information.
- ↥ 51. Someone gave me an IPset file, and my version of the IPset tools will not read the file. What is wrong?
-
Often an IPset tool (for example, rwsetcat) provides a useful error message when it is unable to read an IPset file (e.g.,
set1.set), but sometimes the IPset library suppresses the actual error message and you see the generic message "Unable to read IPset from 'set1.set': File header values incompatible with this compile of SiLK".The tool that can help you determine what is wrong is rwfileinfo. Run rwfileinfo set1.set, and then run rwsetcat --version. There are three things you need to check: the record version, the compression, and IPv6 support.
Record Version: Use the
record-versionvalue in the rwfileinfo output and the following table to determine which version of SiLK is required to read the file. The version of SiLK is printed in the first line of the output from rwsetcat --version.IPset File Version Minimum SiLK Version 0, 1, 2 any 3 3.0.0 4 3.7.0 If your version of SiLK is not new enough to understand the record version, see the end of this answer for possible solutions.
Compression: If SiLK is new enough to understand the record version, next check whether the IPset file is compressed with a library that your version of SiLK does not support. Compare the
compression(id)field in the rwfileinfo output with theAvailable compression methodsfield in the rwsetcat --version output. If the compression used by the file is not available in your build of SiLK, you will be unable to read the file. See the end of this answer for possible solutions.(When the compression library is not available in SiLK, running rwfileinfo set1.set tool may also report the warning "rwfileinfo: Specified compression method is not available 'set1.set'".)
IPv6: If the record version of the IPset file is 3 or 4, the file may contain IPv6 addresses. To read an IPv6 IPset file, you must use SiLK 3.0.0 or later and your build of SiLK must include support for IPv6 Flow records, which you can determine by checking the
IPv6 flow record supportfield in the output from rwsetcat --version.To check whether an IPset file contains IPv6 addresses look at the
record versionandipsetfields of the rwfileinfo output.Record Version IPSet Field Contents 0, 1, 2 not present IPv4 3 ...80b nodes...8b leaves IPv4 3 ...96b nodes...24b leaves IPv6 4 IPv4 IPv4 4 IPv6 IPv6 If the IPset file contains IPv6 addresses, you must use a build of SiLK that includes IPv6 support.
Solutions: There are two solutions to IPset incompatibility.
- The first is for you to upgrade or rebuild your version of SiLK to include whatever feature is missing. In the output from SiLK's configure script, ensure that the compression library is found or that IPv6 is enabled as necessary.
-
The second is to ask the author of the IPset file to rebuild
the file and disable whatever feature is causing issues. If
set1.setcontains only IPv4 addresses, the author can use the following command to convert it to a file of maximum portability:rwsettool --union --record-version=2 --compression-method=none \ --output-path=set1-new.set set1.setIfset1.setcontains IPv6 addresses, the author should use the following command:rwsettool --union --record-version=3 --compression-method=none \ --output-path=set1-new.set set1.set
- ↥ 52. What do all these time switches on rwfilter do?
-
The time switches on rwfilter can cause confusion. The --start-date and --end-date switches are selection switches, while the --stime, --etime, and --active-time switches are partitioning switches.
The --start-date and --end-date switches are used only to select hourly files from the data repository, and these switches cannot be used when processing files specified on the command line. The switches take a single date---with an optional hour---as an argument. Since the switches select hourly files, any precision you specify finer than the hour is ignored. The switches cause rwfilter to select hourly files between start-date and end-date inclusive. See the rwfilter manual page for what happens when only --start-date is specified.
The --stime, --etime, and --active-time switches partition flow records. The switches operate on a per-record basis, and they write the record to the --pass or --fail stream depending on the result of the test. These switches take a date-time range as an argument. --stime asks whether the flow record started within the specified range, --etime asks whether the flow record ended within the specified range, and --active-time asks whether any part of the flow record overlaps with the specified range. When a single time is given as the argument, the range contains a single millisecond. The time arguments must have at least day precision and may have up to millisecond precision. When the start of the range is more course than millisecond precision, the missing values are set to 0. When the end of the range is more more course than millisecond precision, the missing values are set to the maximum value.
To query the repository for records that were active during a particular 10 minute window, you would need to specify not only the --start-date switch for the hour but also the --active-time switch that covers the 10 minutes of interest. In addition, note that the repository stores flow records by their start-time, so when using --etime or --active-time, you may need to include the previous hour's files. Flows active during the first 10 minutes of July 2009 can be found by:
rwfilter --start-date=2009/06/30:23 --end-date=2009/07/01:00 \
    --active-time=2009/07/01:00-2009/07/01:00:10 ...
To summarize, it is important to remember the distinction between selection switches and partitioning switches. rwfilter works by first determining which hourly files it needs to process, which it does using the selection switches. Once it has the files, rwfilter then goes through each flow record in the files and uses the partitioning switches to decide whether to pass or fail it.
- ↥ 53. How do the --start-date and --end-date switches on rwfilter affect which files rwfilter examines?
-
The rules that rwfilter and rwfglob use to select files given arguments to the --start-date and --end-date switches can be confusing. The set of rules are:
- When neither start-date nor end-date is given, rwfilter processes files starting from midnight today to the current hour.
- When end-date is not specified and start-date is specified as YYYY/MM/DD (to day precision), files for that complete day are processed.
- When end-date is not specified and start-date is specified as YYYY/MM/DD:HH (to hour precision) or as seconds since the UNIX epoch, files for that single hour are processed.
- When both start-date and end-date are specified as YYYY/MM/DD, files for the hours YYYY/MM/DDstart:00 to YYYY/MM/DDend:23 are processed.
- When both start-date and end-date are specified as YYYY/MM/DD:HH, files for all hours within that time range are processed.
- When both start-date and end-date are specified seconds since the UNIX epoch, files for all hours within that time range are processed.
- When start-date is specified as YYYY/MM/DD and end-date is specified as YYYY/MM/DD:HH, the hour on the end-date is ignored and Rule 4 is followed.
- When start-date is specified as YYYY/MM/DD:HH and end-date is specified as YYYY/MM/DD, the hour of the start-date is used as the hour for the end-date and Rule 5 is followed.
- When end-date is specified as seconds since the UNIX epoch, the start-date is considered to be in hour precision and Rule 5 is followed.
- When start-date is specified in epoch seconds and end-date is specified as either YYYY/MM/DD or YYYY/MM/DD:HH, the start-date is checked to see if it is evenly divisible by 86400. If it is, the start-date is considered to be in day precision, the hour on the end-date (if any) is ignored, and Rule 4 is followed. If the start-date is not evenly divisible by 86400, the start-date is considered to be in hour precision and either Rule 4 (if end-date includes an hour) or Rule 8 (if no hour on end-date) is followed.
- It is an error to specify end-date without specifying start-date.
The following table provides some examples that may make the rules more clear:
--start-time
value--end-time value None 2009/02/13 2009/02/14 12345696001 2009/02/13T16 12345408002 None today's files Error! May not have end-date without start-date 2009/02/13 20090213.00 through 20090213.23 20090213.00 through 20090213.23 20090213.00 through 20090214.23 20090213.00 through 20090214.005 20090213.00 through 20090213.236 20090213.00 through 20090213.165 12344832003 20090213.00 20090213.00 through 20090213.23 20090213.00 through 20090214.23 20090213.00 through 20090214.00 20090213.00 through 20090213.237 20090213.00 through 20090213.16 2009/02/13T00 20090213.00 20090213.008 20090213.00 through 20090214.008 20090213.00 through 20090214.00 20090213.00 through 20090213.16 20090213.00 through 20090213.16 2009/02/13T14 20090213.14 20090213.148 20090213.14 through 20090214.148 20090213.14 through 20090214.00 20090213.14 through 20090213.16 20090213.14 through 20090213.16 12345336004 20090213.14 20090213.148 20090213.14 through 20090214.148 20090213.14 through 20090214.00 20090213.14 through 20090213.16 20090213.14 through 20090213.16 11234569600 is equivalent to 2009-02-14 00:00:00
21234540800 is equivalent to 2009-02-13 16:00:00
31234483200 is equivalent to 2009-02-13 00:00:00
41234533600 is equivalent to 2009-02-13 14:00:00
5end-date in epoch format forces start-date to be used in hour precision
6end-date hour is ignored when start-date has no hour
7end-date hour is ignored when start-date in epoch format falls on a day boundary
8end-date hour is set to the start-date hour - ↥ 54. Why does --type=inweb contain non-web data?
-
SiLK categorizes a flow as web if the protocol is TCP and either the source port or destination port is one of 80, 443, or 8080. Since SiLK does not inspect the contents of packets, it cannot ensure that only HTTP traffic is written to this type, nor can it find HTTP traffic on other ports.
- ↥ 55. How can I make rwfilter always process incoming and outgoing data?
-
Using the default settings, rwfilter will only examine incoming data unless you specify the --types or --flowtypes switch on its command line. To have rwfilter always examine incoming and outgoing data, modify the
silk.conffile at your site. Find thedefault-typesstatement in that file, and modify it to includeout outweb outicmp. - ↥ 56. Why do different installations of SiLK show different timestamps when viewing the same file and how can I fix this?
-
SiLK stores timestamps as seconds since midnight UTC on Jan 1, 1970 (the UNIX epoch), but these timestamps may be displayed differently depending on how SiLK was configured when it was installed, on your environment variable settings, and on command line switches.
When your administrator built SiLK, she configured it to use either UTC or the local timezone by default (the --enable-localtime switch to configure controls this). To see which setting is enabled at your site, check the Timezone support value in the output from rwfilter --version.
If one or more of your different installations of SiLK are configured to use localtime and the timezones are not identical, the displayed timestamps will be different. There are several work-arounds to make the displayed times agree.
- When a SiLK installation uses the localtime setting, setting the TZ environment variable modifies the timezone in which timestamps are displayed. In particular, setting TZ to 0 causes timestamps to be displayed in UTC.
- The --timestamp-format switch can be used to override the timezone setting in SiLK. Specifying --timestamp-format=utc shows times in UTC, while --timestamp-format=local causes the timestamps to be displayed in the local timezone (subject to modification by the TZ environment variable).
- Using --timestamp-format=epoch displays the timestamps using SiLK's internal representation. (For more on the --timestamp-format switch, see rwcut.)
Finally, note that the timezone setting also effects how tools such as rwfilter parse the timestamps you specify on the command line. If SiLK is configured to use localtime, the timestamps are parsed in the local timezone. In this case, you can use the TZ environment variable to modify which timezone is applied when the times are parsed. Alternatively, you can specify the times as seconds since the UNIX epoch.
- ↥ 57. How do I import flow data into Excel?
-
To get SiLK Flow data into Excel, use the rwcut command to convert the binary SiLK data to a textual CSV (comma separated value) file, and import the file into Excel. You need to provide the --delimited=, --timestatmp-format=iso switches to rwcut. Use the --output-path=FILE.csv switch to have rwcut write its output to a file.
- ↥ 58. How can I use plug-ins (or dynamic-libraries) to extend the SiLK tools?
-
Several of the SiLK tools support extending their capabilities by writing code and including that code into the application:
- rwfilter
- New ways to partition the flow records into the pass-destination and fail-destination can be defined.
- rwcut
- New textual column(s) can be displayed for each flow record.
- rwsort
- Sort-order can be determined by a derived attribute of the flow records.
- rwuniq
- New fields for binning the flow records can be defined and printed, and new value fields that compute an aggregate value across the bins can be defined and printed.
- rwstats
- New fields for binning the flow records can be defined and printed, and new value fields that compute an aggregate value across the bins can be defined and printed. In addition, the output can be sorted using the aggregate field.
- rwgroup
- New fields for binning the flow records can be defined.
The code for these extensions can be written either in C or in Python. (To use Python, SiLK must have been built with the Python extension, PySiLK. See the Installation Handbook for the instructions.)
To use C, one writes the code, compiles it into a shared object, and loads the shared object into the application using the --plugin switch. This process is documented in the silk-plugin(3) manual page.
To use Python, one writes the code and loads it into the application using the --python-file switch. This process is documented in the silkpython(3) manual page.
- ↥ 59. How do I convert packet data (pcap) to flows?
-
There are four ways to handle packet capture (pcap or tcpdump) files.
-
The first approach does not require any software outside of
SiLK; however, it does require that SiLK is built with pcap
support; that is, that libpcap and pcap.h existed when SiLK
was compiled. For this approach, use the
rwptoflow program to
convert each packet to a SiLK Flow record. Note that
rwptoflow does not reassemble fragmented packets, it
does not support IPv6, and it does not combine multiple packets into a
flow. It simply converts each pcap record into a 1-packet SiLK Flow
record.
$ rwptoflow --flow-output=my-data.rw my-data.pcap
-
The second and third approaches both use the yaf program (from the YAF suite), and they both require
that SiLK be built with IPFIX support (provided by libfixbuf--see the Installation Handbook for
details on compiling SiLK with libfixbuf). This second
approach works well if you have a small number of pcap files
covering a fairly small time window. Invoke yaf to
convert the pcap data to the IPFIX format, and use rwipfix2silk to convert
from IPFIX to SiLK Flow records. For maximum compatibility,
you should pass the --silk switch to yaf.
$ yaf --silk --in=my-data.pcap --out=- | rwipfix2silk > my-data.rw
To make this task easier, SiLK provides the rwp2yaf2silk Perl script which is a wrapper around the calls to those two tools. (For rwp2yaf2silk to work, both yaf and rwipfix2silk must be on your $PATH.)$ rwp2yaf2silk --in=my-data.pcap --out=my-data.rw
-
The third approach uses rwflowpack to create a
repository of SiLK Flow data, and this approach is suggested
when you have many pcap files spanning a large time window.
For this approach, use yaf to convert the pcap data to
files of IPFIX records, and have rwflowpack convert the
IPFIX files to a repository of SiLK Flow data.
rwflowpack requires a sensor.conf file that describes
how to define incoming and outgoing data. The following
sensor.conf file categorizes all data as moving between two
hosts outside our network at sensor S0. To query this data
with rwfilter, specify
--type=ext2ext.
probe S0 ipfix
    poll-directory /tmp/rwflowpack/incoming
end probe
sensor S0
    ipfix-probes S0
    source-network external
    destination-network external
end sensor
Have yaf write the IPFIX files into the directory specified in the sensor.conf file.$ yaf --silk --in=my-data.pcap \ --out=/tmp/rwflowpack/incoming/my-data.yafThe invocation of rwflowpack will resemble$ rwflowpack --sensor-conf=sensor.conf --root-directory=/data \ --log-directory=/tmp/rwflowpack/log - The final approach is to use third-party software to convert the pcap data to NetFlow v5 data, and use rwflowpack to convert the NetFlow v5 data to a repository of SiLK Flow data.
-
The first approach does not require any software outside of
SiLK; however, it does require that SiLK is built with pcap
support; that is, that libpcap and pcap.h existed when SiLK
was compiled. For this approach, use the
rwptoflow program to
convert each packet to a SiLK Flow record. Note that
rwptoflow does not reassemble fragmented packets, it
does not support IPv6, and it does not combine multiple packets into a
flow. It simply converts each pcap record into a 1-packet SiLK Flow
record.
- ↥ 60. What is the difference between rwp2yaf2silk and rwptoflow?
-
Both rwp2yaf2silk and rwptoflow read a packet capture file and produce SiLK Flow records. The primary difference is that rwp2yaf2silk assembles multiple packets into a single flow record, whereas rwptoflow does not; instead, it simply creates a 1-packet flow record for every packet it reads. rwp2yaf2silk also is capable of reassembling fragmented packets and it supports IPv6, neither of which rwptoflow can do.
If both tools are available, rwp2yaf2silk is usually the better tool, but rwptoflow can be useful if you want to use the SiLK Flow records as an index into the pcap file (for example, when using rwpmatch).
rwp2yaf2silk is a Perl script that invokes the yaf and rwipfix2silk programs, so both of those programs must exist on your PATH. rwptoflow is a compiled C program that uses libpcap directly to read the pcap file.
Normally yaf groups multiple packets into a single flow record. You can almost force yaf to create a flow record for every packet so that its output is similar to that of rwptoflow: When you give yaf the --idle-timeout=0 switch, yaf creates a flow record for every complete packet and for each packet that it is able to completely reassemble from packet fragments. Any fragmented packets that yaf cannot reassemble are dropped.
- ↥ 61. I have data in some other format. How do I incorporate that into SiLK?
-
If you find yourself using flow data from another analysis platform and would like to import it into a SiLK format, you essentially have two options: you can either replay the flow data or you can convert it with rwtuc.
- Replaying flow data
-
Many flow collection tools have a flow "replay" (for example, the
nfreplaycommand in the nfdump toolset). This is the best way to import data as it essentially rebuilds the flow data and packs it into the SiLK repository.The general process for replaying flow data is as follows:
- Install the SiLK packing infrastructure (if you haven't already).
-
Configure a probe and a sensor to collect the replayed data by
creating a
sensor.conffile. - Start rwflowpack.
-
Replay the flow data. Be sure to direct it to the IP address and
port that you specified in
sensors.conf.
Once you have replayed the flow data, you should be able to query directly against the imported data in the repository using rwfilter selection criteria.
- rwtuc Conversion
-
Although some flow analysis toolkits (including SiLK) do not have a method for replaying flow, they all support some type of text-based output. We can use text output as an input into rwtuc, which will then create the binary SiLK flow files.
Each platform will have different nuances that must be handled. Often the tool's textual output must be modified before feeding it to rwtuc. Perl is good for text manipulation, but nearly any scripting language will work.
The output from each invocation of rwtuc is a single SiLK flow file. To transform those files into a standard SiLK repository of hourly files, run rwflowpack using a
silkprobe and sensor.
- ↥ 62. How do I make lists of IP addresses and label them?
-
A prefix map file in SiLK provides a label for every IPv4 address. (We have not yet extended prefix map files to support IPv6 addresses.) Use the rwpmapbuild tool to convert a text file of CIDR-block/label pairs to a binary prefix map file. The rwcut, rwfilter, rwuniq, and rwsort tools provide support for printing, partitioning by, binning by, and sorting by the labels you defined.
- ↥ 63. How do I mate unidirectional flows to get both sides of the conversation?
-
The rwmatch program can be used to mate flows. Create two files that contain the data you are interested in mating. Use rwsort to order the records in each file. (When matching TCP and/or UDP flows, the recommended sort order is shown below.) Run rwmatch over the sorted files to mate the flows. rwmatch writes a match parameter into the next hop IP field on each record that it matches. When using rwcut to display the output file produced by rwmatch, consider using the
cutmatch.soplug-in to display the match parameter that rwmatch writes into the next hop IP field.$ rwsort --fields=1,4,2,3,5,9 incoming.rw > incoming-query.rw $ rwsort --fields=2,3,1,4,5,9 outgoing.rw > outgoing-response.rw $ rwmatch --relate=1,2 --relate=4,3 --relate=2,1 --relate=3,4 \ incoming-query.rw outgoing-response.rw mated.rw $ rwcut --plugin=cutmatch.so --fields=1,3,match,2,4,5 mated.rw - ↥ 64. I have SiLK deployed in an asymmetric routing environment, can I mate across sensors?
-
Yes, you can use the rwmatch program as described in the previous FAQ entry to mate across sensors.
- ↥ 65. How can I create obfuscated (anonymized) data?
-
There are two general methods: use rwrandomizeip or do it yourself with either rwtuc or the PySiLK extension.
The rwrandomizeip application obfuscates the source and destination IPv4 addresses in a SiLK data file. (When an input file contains IPv6 records, rwrandomizeip converts records that contain addresses in the ::ffff:0:0/96 prefix to IPv4 and processes them. rwrandomizeip silently ignores IPv6 records containing addresses outside of that prefix.) It can operate in one of two modes:
- In default mode, rwrandomizeip substitutes a pseudo-random, non-routable IP address for each source and destination IP address it sees. An IP address that appears multiple times in the input will be mapped to a different output address each time, and no structural information in the input will be maintained.
- In consistent mode, rwrandomizeip creates four shuffle tables, each having 256 entries where the value is a pseudo-random value from 0 to 255. These tables represent the possible values for each octet in an IPv4 address. rwrandomizeip uses the tables to modify the IP addresses in a consistent way, which allows a conversation between two IP addresses to be visible in the anonymized data.
In addition, note that the file's header may contain information that you would rather not make public (such as a history of commands). You can use rwfileinfo to see these headers. To remove the headers, invoke rwcat on the file.
For a different approach, consider converting the data to text with rwcut, obfuscating the IPs, and then converting back to SiLK format with rwtuc. Using PySiLK keeps the data in a binary format and may be faster than text processing. Both of these approaches require you to develop your own obfuscation method. Some ideas are presented next.
What could be useful is to translate addresses into an unused domain. There are three different CIDR/8 blocks that are easy to use:
- 0.0.0.0/8 - IANA reserved test addresses
- 10.0.0.0/8 - Private network addresses
- 127.0.0.0/8 - Loopback addresses
The first two sometimes occur in network traffic (when private traffic is routed), but the last one will not be produced by the protocol stack on any of the common operating systems. It still sometimes occurs as a source address on the Internet, but this is crafted traffic.
There are three different ways to use these addresses. Subnet-preserving substitution translates subnets (either at the /16 or /24 level) into an obfuscated zone, but leaves the host information unchanged to allow structural analysis. Subnet-obfuscating substitution uses an arbitrary but fixed substitution for each host. This allows tracking consistent behavior on the host level, (including matching of incoming and outgoing flows), but makes it difficult to track network structure (including tracking of dynamically-allocated hosts). Host-random substitution uses an arbitrary and varying substitution for each occurrence of a host. This offers the most privacy protection, but it also blocks tracking consistent behavior on either the host or network-structure level.
Even though the data is obfuscated, anonymity cannot be fully guaranteed. If your recipient knows (or can guess) where the data originates, and something about that network (such as the addresses of common servers on that network), they can leverage that information to reduce or eliminate address obfuscation at the subnet-preserving or subnet-obfuscating levels. There are other methods (such as comparing traffic in the released data against traffic the recipients capture on their network) that may reduce the address obfuscation.
As an example, suppose your IP space, 128.2.0.0/16, has three different networks to be obfuscated, containing a total of 10 hosts:
128.2.2.0/24 -- production network
    128.2.2.1 -- production router
    128.2.2.5 -- production server
    128.2.2.7 -- production supervisory workstation

128.2.3.0/24 -- office network
    128.2.3.1 -- office router
    128.2.3.4 -- secretarial workstation
    128.2.3.9 -- accounting database server

128.2.4.0/24 -- border network
    128.2.4.1 -- border router
    128.2.4.5 -- email server
    128.2.4.7 -- dns server
    128.2.4.240 -- gateway to internal network
For subnet-preserving substitution, you could construct a simple sed script. This example assumes the script is called
priv.sedand contains:s/128\.2\.2\./127.0.1/g s/128\.2\.3\./127.0.2/g s/128\.2\.4\./127.0.3/g
These commands simply substitute the network portion of the address at the /24 level into an obfuscated zone. Now we can use this sed script with rwtuc to change flow information:
rwcut --fields=1-11,13-29 myflows.rw |
    sed -f priv.sed | rwtuc --sensor=1 >obflows.rw
This obfuscates both the IP address fields at the subnet level and the sensor field.
For subnet-obfuscating substitution, construct a similar sed script that substitutes IP addresses, rather than just the network portion. This example assumes the script is called
priv2.sedand contains the host addresses of interest and arbitrarily chosen substitutes:s/128\.2\.2\.1/127.0.1.3/g s/128\.2\.2\.5/127.0.5.2/g s/128\.2\.2\.7/127.0.3.1/g s/128\.2\.3\.1/127.0.1.5/g s/128\.2\.3\.4/127.0.5.5/g s/128\.2\.3\.9/127.0.7.2/g s/128\.2\.4\.1/127.0.4.3/g s/128\.2\.4\.5/127.0.2.5/g s/128\.2\.4\.7/127.0.3.7/g s/128\.2\.4\.240/127.0.2.1/g
Again, we can use this sed script with rwtuc to change flow information:
rwcut --fields=1-11,13-29 myflows.rw \
    | sed -f priv2.sed | rwtuc --sensor=1 >ob2flows.rw
This script could also be written in Perl or Python. In those languages, you could match on /128\.2\.\d+\.\d+/ and use the matched text as a key into an associative array to find the replacement address.
For host-random substitution, sed is not a good solution. A fairly simple Python script can implement this substitution. Let us assume that this script is called
hostsub.pyand contains content such as:#!/usr/bin/python import sys import random import re r = random.Random(None) addr=re.compile("\d+\.\d+\.\d+\.\d+") # 0x100 = 256 # 0x10000 = 65536 # 0x1000000 = 16777216 def makeaddr(iaddr): fourth = iaddr % 256 third = int((iaddr % 65536)/256) second = int((iaddr % 16777216)/65536) return '127.'+str(second)+'.'+str(third)+'.'+str(fourth) def ipaddr(line): myline = line pos = 0 while pos < len(myline): while addr.match(myline,pos) == None and pos < len(myline): pos = pos + 1 if pos < len(myline): myline = myline[0:pos]+addr.sub(makeaddr(r.randint(0,16777216)), myline[pos:]) m = addr.search(myline,pos) if m == None: break else: pos = m.end()+1 return myline for line in sys.stdin: line=line[:-1] print ipaddr(line)We can use this python script to obfuscate addresses:
rwcut --fields=1-11,13-29 myflows.rw \
    | ./hostsub.py | rwtuc --sensor=1 > ob3flows.rw
Similar methods (either fixed substitution or random substitution) can be used to obfuscate ports and protocols if needed. To obfuscate dates, one can preserve interval relationships by mapping the earliest date to a known date (Jan 1, 1970 is popular) and determining further dates by interval since the earliest date, or again use a random substitution. Obfuscation of volume information (number of packets, number of bytes, or duration of flow) is rarely needed, but again either a fixed substitution or random substitution may be applied if required.
The amount of obfuscation applied directly limits the utility of the data in analysis, so use care to minimize the obfuscation.
Additional obfuscation ideas or topics:
- Fixed-value replacement: e.g., all sIP become 10.0.0.1, all dIP become 192.168.0.2
- Flow injection: adding manufactured records
- Flow deletion: removing records to break up flow patterns
- Combined strategies
- ↥ 66. How secure is the anonymized data?
-
Anonymizing/Obfuscating data is hard. You should be cautious of how widely you distribute data that rwrandomizeip has processed:
- The rwrandomizeip program only anonymizes the source and destination IP address. Any additional information in the data (such as the existence of services that run on well known ports or protocols) is still visible.
- In consistent mode, the data is much less random, since the value in an octet is always mapped to the same value. Given the structure of IP addresses on the Internet, reversing the mapping would not be difficult.
- The default mode does not suffer from that problem, but you cannot do any meaningful traffic analysis on the anonymized data since the mapping is not consistent.
- ↥ 67. How can I produce multiple output files from a single rwfilter data pull from the repository?
-
Suppose you have the following task: For all the SiLK flow records received on Feb 6, 2014, create eight files that approximate the following:
- All HTTP traffic, http.rw
- All HTTPS traffic, https.rw
- All SSH traffic, ssh.rw
- Any other TCP traffic, tcp.rw
- All UDP-based DNS traffic, dns.rw
- All DHCP traffic, dhcp.rw
- Any other UDP traffic, udp.rw
- Any traffic not captured above, other.rw
One way to approach the eight requests in this task is to run a separate rwfilter command for each output. The commands to get the results for Requests 1-3 and 5-6 are straightforward. The commands for Requests 4, 7, 8 are also simple once you realize you just need to create a list of ports or protocols that omit those used in the other queries:
rwfilter ... --pass=http.rw  --proto=6  --aport=80
rwfilter ... --pass=https.rw --proto=6  --aport=443
rwfilter ... --pass=ssh.rw   --proto=6  --aport=22
rwfilter ... --pass=tcp.rw   --proto=6  --aport=0-21,23-79,81-442,444-
rwfilter ... --pass=dns.rw   --proto=17 --aport=53
rwfilter ... --pass=dhcp.rw  --proto=17 --aport=67,68
rwfilter ... --pass=udp.rw   --proto=17 --aport=0-52,54-66,69-
rwfilter ... --pass=other.rw --proto=0-5,7-16,18-
Where "..." represents the file selection criteria. Since the task is for all traffic on Feb 6, 2014, replace the "..." with
--flowtype=all/all --start-date=2014/02/06
The file selection criteria are not pertinent to this discussion, so the sample code below will use "...".
(For many sites, any incoming and outgoing TCP traffic on ports 80, 443, and 8080 will be written into the "inweb" and "outweb" types. The file selection criteria could be smarter and exclude the "in" and "out" types when looking for HTTP and HTTPS traffic.)
The rwfilter commands assume that all traffic for the desired protocols occur on that protocol's advertised port. If your flow records were collected with YAF and the appLabel feature was enabled, you could replace the --proto and --aport switches with the --application switch.
You may realize that this is not very efficient, since each of those rwfilter commands is independently processing every record in the data repository. If your data repository is small or if this is a one-time task, you and your system administrator may be willing to live with the inefficiency.
Manifold definition
The idea of an rwfilter "manifold" is to create many output files while only making one pass over the data in the file repository, making the task more efficient both in terms of resources and in the time it takes to get the results.
The rwfilter manifold uses a chain of rwfilter commands and employs both the --pass and --fail switches to create files along the chain of commands.
For example, here is a simple manifold that creates four output files---for TCP, UDP, ICMP, and OTHER protocols:
rwfilter ... --proto=6  --pass=tcp-all.rw  --fail=-                   \
  | rwfilter --proto=17 --pass=udp-all.rw  --fail=-            stdin  \
  | rwfilter --proto=1  --pass=icmp-all.rw --fail=other-all.rw stdin
The first rwfilter command writes all TCP flow records into tcp-all.rw. Any non-TCP flow records are written to the standard output ("-").
The second rwfilter command reads the first rwfilter's standard output as its standard input---note the stdin at the end of the second line. (When looking at existing uses of the manifold, instead of seeing a stdin argument you may see it expressed using the command line switch --input-pipe=stdin. The forms are equivalent, though note that the --input-pipe switch is deprecated.) Any UDP flow records are written to the udp-all.rw file, and all non-UDP flows are written to the standard output.
The third rwfilter command reads the second's standard output. The ICMP traffic is written to the file icmp-all.rw, and all remaining traffic is written to other-all.rw.
From within Python
To run a chain of rwfilter commands in Python, consider using the utilities available in the
netsa.util.shellmodule that is part of the netsa-python library.The rwfilter commands that comprise the manifold could be written using netsa-python as:
from netsa.util.shell import *
c1 = command("rwfilter ... --proto=6 --pass=tcp-all.rw --fail=-")
c2 = command("rwfilter --proto=17 --pass=udp-all.rw --fail=- stdin")
c3 = command("rwfilter --proto=1  --pass=icmp-all.rw"
             + " --fail=other-all.rw stdin")
run_parallel(pipeline(c1, c2, c3))
Writing the manifold
The rwfilter manifold is a powerful idea, and composing the rwfilter commands is fairly simple as long as you are pulling data out of the stream at every step.
To return to the task defined at the beginning of this document: Since the set of records returned by the each of the requests in the task do not overlap, we can get the results using a simple manifold. Our manifold assumes that the data is sane---for example, we assume that no traffic goes from port 80 to port 22---and we use a "first-match wins" rule.
The easiest way to write the manifold is as a single chain of rwfilter commands, where each rwfilter command removes some of the records. (This chain uses the command line argument of "-" to tell rwfilter to read from the standard input, and it is equivalent to the stdin command line argument used above.)
rwfilter ... --proto=6  --aport=80    --pass=http.rw  --fail=-          \
  | rwfilter --proto=6  --aport=443   --pass=https.rw --fail=-        - \
  | rwfilter --proto=6  --aport=22    --pass=ssh.rw   --fail=-        - \
  | rwfilter --proto=6                --pass=tcp.rw   --fail=-        - \
  | rwfilter --proto=17               --pass=-        --fail=other.rw - \
  | rwfilter            --aport=53    --pass=dns.rw   --fail=-        - \
  | rwfilter            --aport=67,68 --pass=dhcp.rw  --fail=udp.rw   -
The first four rwfilter commands create the files for Requests 1-4. The fourth rwfilter command does not need to specify a port list since the data for ports 22, 80, and 443 has already been removed.
Note that the fifth rwfilter command sends records that pass the filter to the standard output and writes records that fail the filter to a file. This rwfilter command creates the file for Request 8.
The sixth rwfilter command handles Request 5. The --proto switch is no longer required since we know all the flow records represent UDP traffic.
The seventh rwfilter command handles Requests 6 and 7.
The manifold in Python
To write that manifold using the
netsa.util.shellmodule of the netsa-python library:from netsa.util.shell import * pl = ["rwfilter ... --proto=6 --aport=80 --pass=http.rw --fail=-", "rwfilter --proto=6 --aport=443 --pass=https.rw --fail=- -", "rwfilter --proto=6 --aport=22 --pass=ssh.rw --fail=- -", "rwfilter --proto=6 --pass=tcp.rw --fail=- -", "rwfilter --proto=17 --pass=- --fail=other.rw -", "rwfilter --aport=53 --pass=dns.rw --fail=- -", "rwfilter --aport=67,68 --pass=dhcp.rw --fail=udp.rw -"] run_parallel(pipeline(pl))Instead of explicitly using the command() constructor as in the previous example, we hand a list of strings to the pipeline() constructor.
The manifold and named pipes
This single chain of rwfilter commands is straightforward, but there is still some inefficiency: The TCP check occurs in each of the first four rwfilter commands. If the data set is small, you may not care about this inefficiency.
A more efficient approach is to split the TCP traffic into a separate chain of rwfilter commands. This speeds the query in two ways:
- The chain handling TCP traffic is no longer reading and writing the records for UDP and other protocols traffic.
- The two chains can run in parallel.
To split the traffic (and run on it in parallel), you need to use a UNIX construct called a named pipe. A named pipe (also known as a FIFO [first in, first out]), operates like a traditional UNIX pipe except that it is "named" by being represented in the file system.
To create a named pipe, use the mkfifo command and give a location in the file system where you want to create the FIFO.
mkfifo /tmp/fifo1
Once you create a named pipe, you can almost treat it as a standard file by writing to it and reading from it. However, a process that is writing to the named pipe will block (not complete) until there is a process that is reading the data. Likewise, a process that is reading from the named pipe will block until another process writes its data to the named pipe.
Because of the potential for processes to block, one normally enters the command that reads from the named pipe first and creates it as a background process, and then one creates the process that writes to the named pipe.
For example, the shell command
ls | sort -rprints the entries in the current directory in reverse order. To do this using the named pipe /tmp/fifo1, you use:sort -r /tmp/fifo1 & ls > /tmp/fifo1
Create the read process first (the process that would go after the "
|" when using an unnamed-pipe), then create the write process (the process that would go before the "|").Before we introduce the named pipe into the rwfilter manifold, let us determine the rwfilter commands we would use in the shell if we were using temporary files.
The rwfilter command to divide traffic into TCP and into non-TCP is
rwfilter ... --proto=6 --pass=all-tcp.rw --fail=non-tcp.rw
The output for Requests 1-4 can be created by using an rwfilter manifold where the first rwfilter command reads the all-tcp.rw file:
rwfilter     --aport=80  --pass=http.rw  --fail=-      all-tcp.rw  \
  | rwfilter --aport=443 --pass=https.rw --fail=-      -           \
  | rwfilter --aport=22  --pass=ssh.rw   --fail=tcp.rw -
The rwfilter commands to create the files for Requests 5-8 are just like those that we used in our initial manifold solution, where the first rwfilter command reads the non-tcp.rw file:
rwfilter --proto=17        --pass=-       --fail=other.rw non-tcp.rw \
  | rwfilter --aport=53    --pass=dns.rw  --fail=-        -          \
  | rwfilter --aport=67,68 --pass=dhcp.rw --fail=udp.rw   -
You could invoke the three previous rwfilter commands using two named pipes---one for each of the two temporary files. Alternatively, you could use one named pipe and one standard (unnamed) pipe.
The following uses a single named pipe to replace the all-tcp.rw file, and uses an unnamed pipe in place of non-tcp.rw. The following is rwfilter manifold in the bash shell, and note the use of the
( ... ) &construct to background a series of commands.rm -f /tmp/fifo1 mkfifo /tmp/fifo1 (rwfilter --aport=80 --pass=http.rw --fail=- /tmp/fifo1 \ | rwfilter --aport=443 --pass=https.rw --fail=- - \ | rwfilter --aport=22 --pass=ssh.rw --fail=tcp.rw - ) & rwfilter ... --proto=6 --pass=/tmp/fifo1 --fail=- \ | rwfilter --proto=17 --pass=- --fail=other.rw - \ | rwfilter --aport=53 --pass=dns.rw --fail=- - \ | rwfilter --aport=67,68 --pass=dhcp.rw --fail=udp.rw -
Named pipes and Python
Once you begin to use named pipes in the rwfilter manifold, the advantage of the
netsa.util.shellmodule in the netsa-python library over using the shell becomes apparent.When you run your commands in the shell, you need to ensure that the commands that read from the named pipe(s) are created in the background before the commands that write to the named pipe(s). A second problem is error handling: When a process exits abnormally in the shell, the shell may kill the commands downstream of the failed process but other processes may hang indefinitely.
The run_parallel() command in
netsa.util.shellhandles these situations for you. You do not need to be (as) concerned with the order of your commands, and it kills all your subprocesses when any command fails.To create the manifold in netsa-python using a named pipe, you use:
import os
from netsa.util.shell import *
pl = ["rwfilter --aport=80  --pass=http.rw  --fail=-      /tmp/fifo1",
      "rwfilter --aport=443 --pass=https.rw --fail=-      -",
      "rwfilter --aport=22  --pass=ssh.rw   --fail=tcp.rw -"]
p2 = ["rwfilter ... --proto=6 --pass=/tmp/fifo1 --fail=-",
      "rwfilter --proto=17    --pass=-          --fail=other.rw -",
      "rwfilter --aport=53    --pass=dns.rw     --fail=-        -",
      "rwfilter --aport=67,68 --pass=dhcp.rw    --fail=udp.rw   -"]
os.unlink("/tmp/fifo1")
run_parallel("mkfifo /tmp/fifo1")
run_parallel(pipeline(pl), pipeline(p2))
An entirely different approach
Finally, as an alternative the rwfilter manifold, you could use something like the Python script below which uses PySiLK, the SiLK Python extension library.
This script reads SiLK flow records and splits them into files based on the protocols and ports. The script accepts one or more files on the command line or it reads flow records on its standard input.
The Python code in this script will be slower than the manifold solutions presented above, and---depending on your site's configuration---it may even be slower than making multiple passes over the data. The script has the advantage that you only do a single pass over the data, and it is easy enough to modify.
Note the example in the file's comments of using a tuple file to whittle the data before sending it to the script. Doing this feeds the Python script only the data you are actually going to process and store.
Another option to reduce the amount of data the script processes is to use a simple manifold to split the data into TCP, UDP, and OTHER data files, and then create modified copies of this script that operate on a single protocol.
#!/usr/bin/env python # # Read SiLK Flow records and split into multiple files depending on # the protocol and ports that a record uses. # # Invoke as # # split-flows.py YEAR MONTH DAY FILE [FILE...] # # or to read from stdin: # # split-flows.py YEAR MONTH DAY # # Code assumes the incoming data is for a single day. # # Records are split into multiple files, where the file name's # prefixes are specified in the 'file' dictionary. For example, # output files are named 'tcp-80-YEAR-MONTH-DAY.rw', # 'udp-53-YEAR-MONTH-DAY.rw' for TCP traffic on port 80 and UDP # traffic on port 53, respectively. # # The splitting logic is hard-coded in the main processing loop. # # Any TCP traffic that is not matched goes into a file named # tcp-other-YEAR-MONTH-DAY.rw. Any UDP traffic that is not # matched goes into a file named udp-other-YEAR-MONTH-DAY.rw. Any # other unmatched traffic goes into a file named # other-YEAR-MONTH-DAY.rw. # # If you do not care about the leftover data (that is, you do not # want any of the "other" files), you can reduce the amount of # traffic this script gets by filtering the data using a tuple # file. For example, store the following (remove the leading '#') # into the text file /tmp/tuples.txt # # proto | sport # 6 | 80,443,22 # 17 | 53,67,68 # # Invoke rwfilter and pipe the result to this script as: # # rwfilter --start-date=2011/12/13 \ # --types=in,out,inweb,outweb \ # --proto=6,17 \ # --tuple-file=/tmp/tuples.txt \ # --tuple-direction=both \ # --pass=stdout # | python split-flows.py 2011 12 13 # # (The reason for the --proto=6,17 switch (which duplicates some of # the effort) is to reduce the number of records that we have to # search for in the red-black tree that the tuple-file creates.) # # Ideas for expansion: # * Use the "manifold" (chained rwfilter commands) to split the # data into the protocols first, then create two versions of this # script: one for TCP and one for UDP. # rwfilter ... --proto=6 --pass=tcp-all.rw --fail=- \ # | rwfilter --proto=17 --pass=udp-all.rw --fail=other.rw # * Change the code instead of hard-coding the file prefixes and # the logic that splits flows. For example, use lambda # functions, nested dictionaries, ... # * Have this script invoke rwfilter for you # * Have the script determine the date by looking at the start time # of the first record it sees. # # # Use print functions (Compatible with Python 3.0; Requires 2.6+) from __future__ import print_function # Import the PySiLK bindings from silk import * # Import sys for the command line arguments. import sys # Where to write output files. CUSTOMIZE THIS. output_dir = "/tmp" # Files that will be created. CUSTOMIZE THIS. The key is the file # name's prefix. The value will be the SilkFile object once the file # has been opened. Currently logic to do the splitting is hard-coded. file = {'http' : None, 'https' : None, 'ssh' : None, 'tcp-other' : None, 'dns' : None, 'dhcp' : None, 'udp-other' : None, 'other' : None, }; # Main function def main(): # Get the date from the command line if len(sys.argv) < 4: print ("Usage: %s year month day [infile1 [infile2...]]" % sys.argv[0]) sys.exit(1) year = sys.argv[1] month = sys.argv[2] day = sys.argv[3] infile = None # Open the first file for reading arg_index = 4 if len(sys.argv) == arg_index: infile = silkfile_open('-', READ) else: infile = silkfile_open(sys.argv[arg_index], READ) arg_index += 1 # Open the output files for k in file.keys(): name = "%s/%s-%s-%s-%s.rw" % (output_dir, k, year, month, day) file[k] = silkfile_open(name, WRITE) # Loop over the input files while infile is not None: # Loop over the records in this input file for rec in infile: # Split the record into a single file. CUSTOMIZE THIS. # First match wins. if rec.protocol == 6: if (rec.sport == 80 or rec.dport == 80): file['http'].write(rec) elif (rec.sport == 443 or rec.dport == 443): file['https'].write(rec) elif (rec.sport == 22 or rec.dport == 22): file['ssh'].write(rec) else: file['tcp-other'].write(rec) elif rec.protocol == 17: if (rec.sport == 53 or rec.dport == 53): file['dns'].write(rec) elif (rec.sport in [67,68] or rec.dport in [67,68]): file['dhcp'].write(rec) else: file['udp-other'].write(rec) else: file['other'].write(rec) # Move to the next file on the command line if arg_index == len(sys.argv): infile.close() infile = None else: try: infile = silkfile_open(sys.argv[arg_index], READ) arg_index += 1 except IOError: print("Error: unable to open file %s" % sys.argv[arg_index]) infile = None # Close output files for k in file.keys(): try: file[k].close except: print("OOPS! Error closing file for key %s" % k) # Call the main() function when this program is started if __name__ == '__main__': main() - ↥ 68. How do I identify clients and servers from source-IP and destination-IP?
-
SiLK records are uni-directional and contain a source-IP (sIP) and destination-IP (dIP). Often you want to interpret those IPs as "client" and "server", where the "client" is defined as the host "initiating" the connection.
Answer 1: Use "initial-flags"
Probably the most effective way to separate clients from servers is to check the intial-flags with rwfilter. TCP conversations with --flags-initial=S/SA are those which are initiated by the client (the first packet was the client SYN) so the client is the source address, the server is the destination address, and the service is the destination port.
Similarly, you might look at TCP conversations with --initial-flags=SA/SA. These are typically flows where the first packet was the server's SYN-ACK, so the source address is the server, the destination address is the client, and the service is the source port.
If you are using YAF for flow collection, you can capture initial flags; however, if you're using many of the standard collection engines, initial flags are not captured, so you can't query against them and this approach does not work.
Answer 2: Use a port-based approach
The most common service ports are below 1024, and ephemeral ports are always greater than 1024. Taking advantage of this, we can create an IP set of these services by looking for ephemeral port connections something like this:
rwfilter {selection criteria}       \
    --protocol=6,17                 \
    --sport=1-1023 --dport=1024-    \
    --pass=stdout                   \
| rwset --sip-file=servers.set --dip-file=clients.set
Now, suppose after looking at the leftover traffic that has neither port below 1024, you find some additional common service ports like 1935 (Flash) and 8080 (HTTP proxy). This example shows how to add these extra service ports and how to generate a list of service addresses and ports instead of IPsets:
rwfilter {selection criteria}                \
    --protocol=6,17                          \
    --sport=1-1023,1935,8080 --dport=1024-   \
    --pass=stdout                            \
| rwuniq --fields=sip,sport
Answer 3: Use a port-based prefix map
This approach builds off of Answer 2. In this case, rather than create a long list of ports, we put the list in a prefix map and query off the prefix map. Here is how it works.
First, create the prefix map that defines ports on which you expect services. Note that prefix maps are hierarchical, so the generic range-based assignments are overwritten by more specific entries. The text file used to build a port-based prefix map looks like this:
mode proto-port                 #this is a port-based pmap
default             Unknown     #for non-TCP/UDP traffic
6/0      6/1023     Service     #All ports below 1024 are service ports
17/0     17/1023    Service
6/1024   6/65535    Ephemeral   #Non-service ports should be ephemeral ports
17/1024  17/65535   Ephemeral
6/1935   6/1935     Service     #Flash
17/1935  17/1935    Service
6/8080   6/8083     Service     #HTTP Proxy
[...]
Second, compile the prefix map:
rwpmapbuild --input=ports.pmap.txt --output=ports.pmap
Finally, use the compiled prefix map to separate client and server traffic using a command very similar to what we defined above:
rwfilter {selection criteria}                     \
    --protocol=6,17                               \
    --pmap-file=ports.pmap                        \
    --pmap-sport=Service --pmap-dport=Ephemeral   \
    --pass=stdout                                 \
| rwuniq --fields=sip,sport
Answer 4: A Time-Based Approach (not recommended)
You may try to identify clients and servers by using timing information. Assuming the first flow seen was initiated by the client, the source address is the client and the destination address is the server. However, this technique is actually very tricky and often does not work well. It assumes that you have both directions of the flow, and that the times are recorded very accurately (this is especially difficult with asymmetric routing).
Don't forget about FTP!
Keep passive FTP data channels in mind, since they often look like high-port to high-port services. Active FTP data channels make your FTP client look like a server. There is another FAQ entry on identifying FTP traffic; it is best to try and remove FTP data channels before trying to build up a list of clients and servers.
- ↥ 69. How do I identify FTP traffic?
-
FTP traffic consists of two types of sessions: control sessions and data transfers. The control session consists of a client TCP connection (ephemeral port to port 21) and its return traffic. The data transfer itself will occur either in active or passive mode:
- Active mode: Server connects from port 20 to a (client-specified) ephemeral port on the client.
- Passive mode: Client connects from an ephemeral port to a (server-specified) ephemeral port on the server
There are two approaches to identifying FTP traffic: (1)Using rwfilter --tuple and (2)using IPset files. The first approach is more robust (finds fewer false positives) than the second but it is slower.
In both methods, traffic on the control channel is used to identify the IP addresses communicating via FTP, and then the FTP flow records between those hosts is found. TCP flags are not included when searching for FTP traffic, since a long FTP transfer may be broken across multiple flow records.
Identifying FTP flows using the --tuple option
This method creates a list of source-destination IP pairs that communicated on the control channel. Those IP pairs are used with the rwfilter --tuple option to isolate the FTP traffic.
It may be possible for these hosts to have non-FTP sessions between them which would also be identified as FTP using this methodology, but that situation would likely be rare.
First, find the source-destination IP pairs for internally hosted FTP servers. Using the outbound traffic minimizes the noise caused by scanning.
rwfilter --type=out --start-date=$START --end-date=$END         \
    --sport=21 --protocol=6 --packets=2- --pass-destination=-   \
| rwuniq --fields=sip,dip                                       \
| cut -f 1,2 -d '|'                                             \
> served-sipdip.txt
Now get all the outbound FTP traffic for internal FTP servers: use the IP pairs combination for ephemeral-to-ephemeral traffic in addition to 20-to-ephemeral and 21-to-ephemeral, which should be only FTP traffic.
rwfilter --type=out --start-date=$START --end-date=$END         \
    --tuple-file=served-sipdip.txt --tuple-direction=forward    \
    --sport=20,21,1024- --dport=1024- --protocol=6              \
    --pass-destination=served-out.rw
Similarly, pull the associated inbound traffic, changing the tuple direction.
rwfilter --type=in --start-date=$START --end-date=$END          \
    --tuple-file=served-sipdip.txt --tuple-direction=reverse    \
    --dport=20,21,1024- --sport=1024- --protocol=6              \
    --pass-destination=served-in.rw
You now have the traffic for FTP servers inside your organization. The workflow is similar to find clients within your organization communicating with external FTP servers: simply swap the arguments to the --sport and --dport switches. For example:
rwfilter --type=out --start-date=$START --end-date=$END         \
    --dport=21 --protocol=6 --packets=2- --pass-destination=-   \
| rwuniq --fields=sip,dip                                       \
| cut -f 1,2 -d '|'                                             \
> client-sipdip.txt
If the goal is to eliminate FTP traffic from a particular analysis workflow, the procedure is to produce the
served-sipdip.txtandclient-sipdip.txtfiles, then remove their associated traffic from rwfilter's output as shown below. The first rwfilter command selects the traffic you want to analyze. That data is passed through two rwfilter invocations to remove the FTP traffic. Note the use of the --fail-destination option to remove the traffic that matches the filter.For the outbound traffic:
rwfilter --type=out --pass-destination=stdout ... \
| rwfilter \
    --tuple-file=served-sipdip.txt --tuple-direction=forward \
    --sport=20,21,1024- --dport=1024- --protocol=6 \
    --fail-destination=stdout \  # Outbound data served from internal servers
| rwfilter \
    --tuple-file=client-sipdip.txt --tuple-direction=forward \
    --sport=1024- --dport=20,21,1024- --protocol=6 \
    --fail-destination=stdout \  # Outbound client requests
| ...
For the inbound traffic:
rwfilter --type=in --pass-destination=stdout ... \
| rwfilter \
    --tuple-file=served-sipdip.txt --tuple-direction=reverse \
    --dport=20,21,1024- --sport=1024- --protocol=6 \
    --fail-destination=stdout  \ # Inbound requests to internal servers
| rwfilter \
    --tuple-file=client-sipdip.txt --tuple-direction=reverse \
    --dport=1024- --sport=20,21,1024- --protocol=6 \
    --fail-destination=stdout \  # Inbound data served from external servers
| ...
Identifying FTP flows using IPset files
The method using IPsets is inferior to the option above, but may be faster. The IPset method is inferior because there may be cases where server A has an FTP session with host B, and server C has an FTP session with host D, but ephemeral-to-ephemeral traffic between server A and host D is also extracted as FTP data without further evaluation, when A and D may not have an FTP session between them.
This may be a rare case in practice, however. A cursory test showed less than 1% additional flows captured by the set method vs. the tuple method. While this difference could be acceptable for gross traffic statistics, if using the remaining flows for security purposes, the analyst should probably be more cautious and use the tuple method instead.
Make a list of all the source IPs and destination IPs for internally hosted FTP servers. Using the outbound traffic minimizes the noise caused by scanning.
rwfilter --type=out --start-date=$START --end-date=$END         \
    --sport=21 --protocol=6 --packets=2- --pass-destination=-   \
| rwset --sip-file=ftpintservers.set --dip-file=ftpextclients.set
Now get all the outbound FTP traffic for internal FTP servers: use the IPsets for ephemeral-to-ephemeral traffic in addition to 20-to-ephemeral and 21-to-ephemeral, which should be only FTP traffic.
rwfilter --type=out --start-date=$START --end-date=$END         \
    --sipset=ftpintservers.set --dipset=ftpextclients.set       \
    --sport=20,21,1024- --dport=1024- --protocol=6              \
    --pass-destination=served-out.rw
Similarly, pull the associated inbound traffic, swapping the IPsets and the source and destination ports.
rwfilter --type=in --start-date=$START --end-date=$END          \
    --sipset=ftpextclients.set --dipset=ftpintservers.set       \
    --dport=20,21,1024- --sport=1024- --protocol=6              \
    --pass-destination=served-in.rw
You now have the traffic for FTP servers inside your organization. The workflow is similar to find clients within your organization communicating with external FTP servers: simply swap the arguments to the --sport and --dport switches. For example:
rwfilter --type=out --start-date=$START --end-date=$END         \
    --dport=21 --protocol=6 --packets=2- --pass-destination=-   \
| rwset --sip-file=ftpintclients.set --dip-file=ftpextservers.set
To eliminate the FTP traffic from a particular analysis workflow, perform the following operations. (Again, note the use of the --fail option to remove the traffic that matches the filter.)
For the outbound traffic:
rwfilter --type=out --pass-destination=- ... \
| rwfilter \
    --sipset=ftpintservers.set --dipset=ftpextclients.set \
    --sport=20,21,1024- --dport=1024- --protocol=6 \
    --fail-destination=stdout \  # Outbound data served from internal servers
| rwfilter \
    --sipset=ftpintclients.set --dipset=ftpextservers.set \
    --sport=1024- --dport=20,21,1024- --protocol=6 \
    --fail-destination=stdout \  # Outbound client requests
| ...
For the inbound traffic:
rwfilter --type=in --pass-destination=- ... \ | rwfilter \ --sipset=ftpextclients.set --dipset=ftpintservers.set \ --dport=20,21,1024- --sport=1024- --protocol=6 \ --fail-destination=stdout \ # Inbound requests to internal servers | rwfilter \ --sipset=ftpextservers.set --dipset=ftpintclients.set \ --dport=1024- --sport=20,21,1024- --protocol=6 \ --fail-destination=stdout \ # Inbound data served from external servers | ... - ↥ 70. How do I use Graphviz to visualize associations?
-
Visualizing flows allows one to easily see interactions that are harder to see in textual flow output. A directed graph can be used to show the directions of traffic entering and leaving each IP address (or vertex).
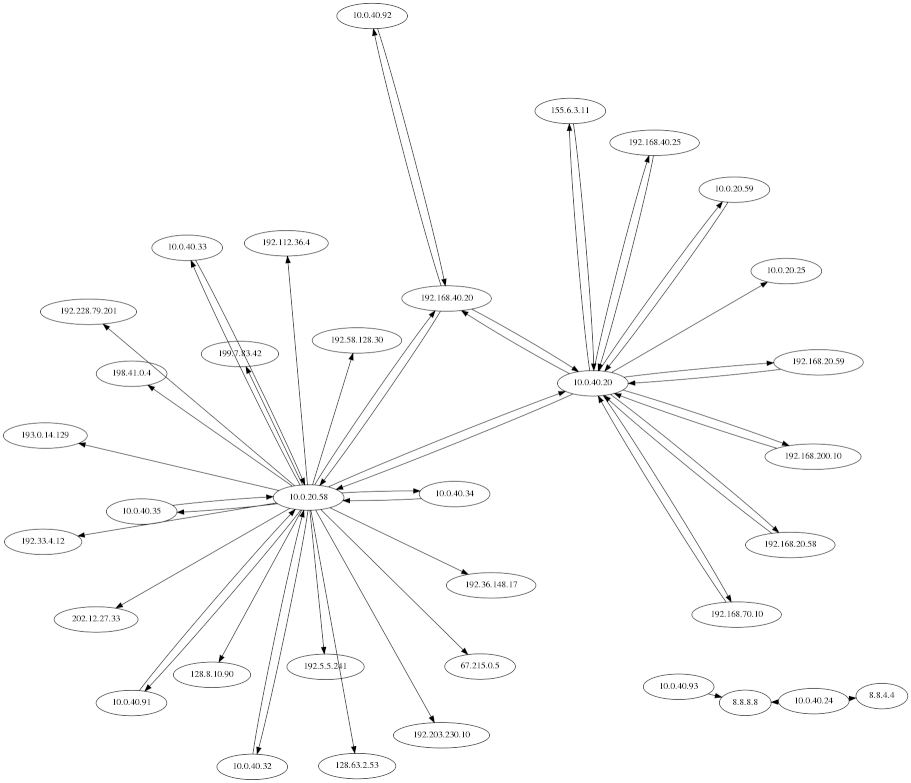
Graphviz is a popular open-source graph drawing software that can draw many types of graphs. Graphviz does not scale as well as SiLK; in addition, graphs with hundreds of nodes are difficult to navigate. Traffic should be reduced to a reasonable size before using the Graphviz tools.
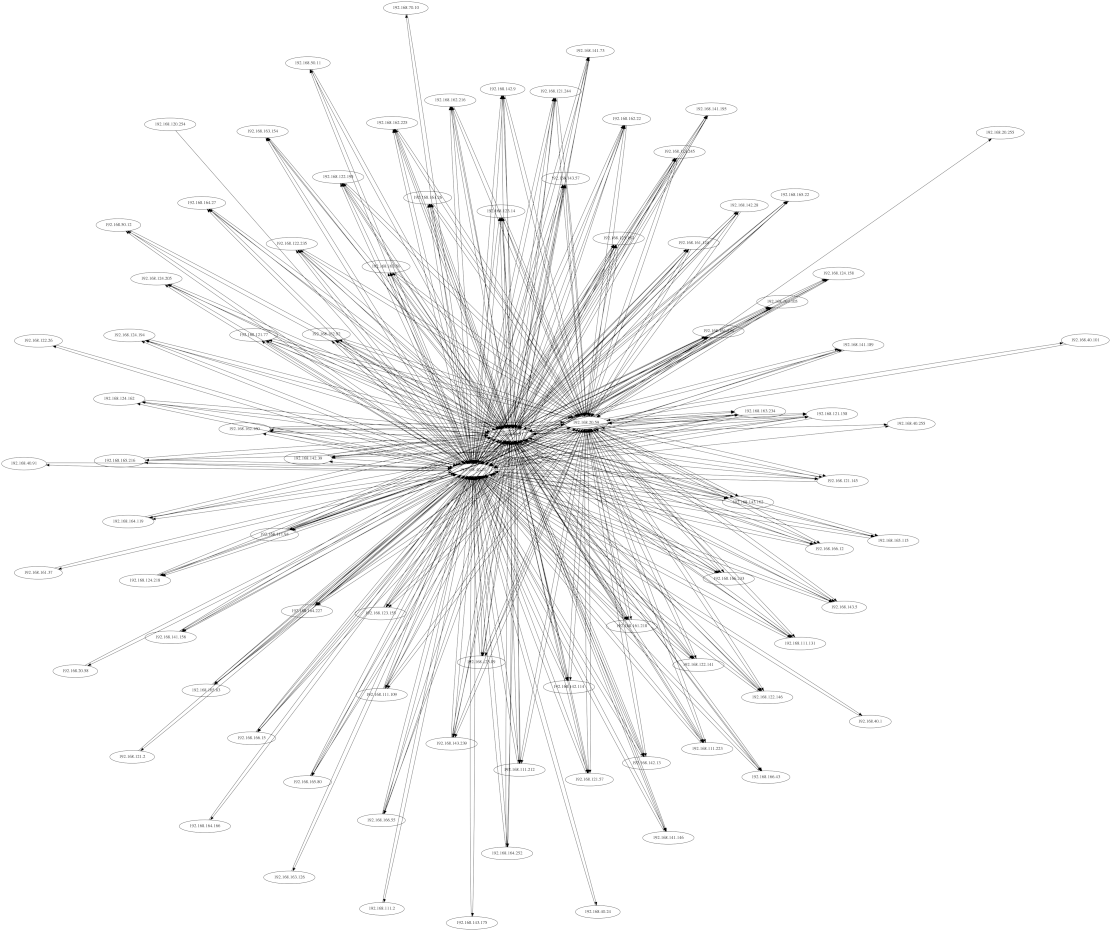
Suggestions to reduce data size are to consider only one port, use an IPset to limit the number of IP addresses, and limit the types of traffic (e.g.,
inwebandoutweb)filter.$ rwfilter flowfile.rw --any-set=interesting.set --aport=80 \ --types=inweb,outweb --pass=interesting.rwThe input to the Graphviz tools is a file in the DOT language. A simple example file,
simple.dot, looks like this:digraph GraphOfMyNetwork { overlap=scale "10.1.1.1" -> "10.2.2.2" "10.2.2.2" -> "10.1.1.1" "10.1.1.1" -> "10.3.3.3" "10.4.4.4" -> "10.5.5.5" }The first line defines the name of the graph. The attributes and data are given inside the brackets
{ }. The lineoverlap=scaleis an attribute that usually increases readability of output graphs. Graphviz assumes that overlapping each vertex is permitted if this option is omitted, thus reducing graph compile time but often resulting in an unreadable graph.Now we need to compile the dotfile to produce an image in the desired format. The svg is ideal for zooming in and out and loading portions of the graph on demand; however, not all viewers support the svg file format.
dot -Tsvn sample.dot -o sample.svg

The other output types available include ps, gif, pdf, png, and many others. For a complete list see the Graphviz documentation.
Other layouts can be generated with neato. In contrast to the dot command, neato organizes the output in the spring model or energy minimized layouts. To use neato to generate a png file:
neato -Tpng sample.dot -o sample2.png
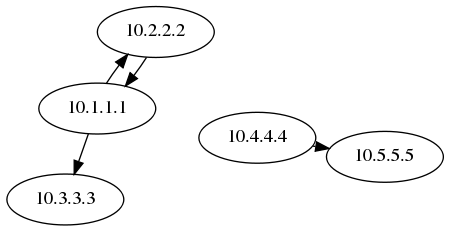
Creating a file in the DOT language can be done on the command line by modifying the output of the SiLK tool rwuniq. The following commands take the output of an rwfilter command and show how it can be converted to the DOT language for graphing.
First, add the title and scaling overlap option to the output file.
echo -e "digraph my_graph {\noverlap=scale\n" > interesting.dotRun rwfilter and rwuniq, and use UNIX text-processing tools to strip the record-count column and add quotation marks around the IP addresses.
rwfilter interesting.rw --aport=53 --type=in,out --pass=stdout \
| rwuniq --fields=1-2 --sort-output --no-titles --delimited=,  \
| cut -d , -f 1,2
| sed 's/,/" -> "/;s/^/"/;s/$/"/' >> interesting.dot
Finally, end the file with a file closing bracket
echo "}" >> interesting.dot
This dot file can be edited if you would like to add some graph parameters that can include: colorizing, labeling, changing the shape of the vertex and more. See the Graphviz documentation for more information.
- ↥ 71. How do I use gnuplot with rwcount's output?
-
Gnuplot is a scientific visualization and plotting tool that provides command-line facilities for generating charts from text data. Combined with the SiLK toolset it provides facilities for quickly visualizing data for exploratory analysis or systematic reporting.
The easiest way to combine SiLK data with gnuplot is through rwcount. For example:
$ rwcount --bin-size=3600 sample.rw > sample.txt
$ gnuplot
gnuplot> plot "sample.txt" using 2 with linespoints
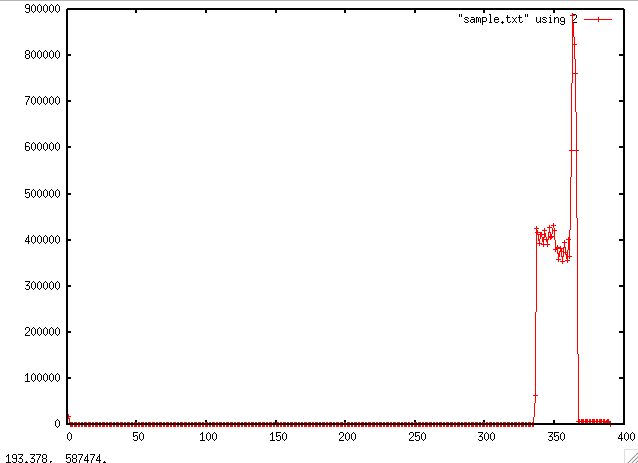
This produces a simple image like the one shown here. Gnuplot is very good at producing unattractive plots with minimal instruction. In this case, we have the following problems to consider:
- The scale is linear, which for this data results in a single spike dominating traffic.
- The x axis values are meaningless.
- The label is the filename.
All of these can be easily fixed. Here's an improved command using gnuplot and the image it produces.
gnuplot> set xdata time
gnuplot> set timefmt "%Y/%m/%dT%H:%M:%S"
gnuplot> set logscale y
gnuplot> set yrange [1000:]
gnuplot> plot 'sample.txt' using 1:2 title 'Records with linespoints 3
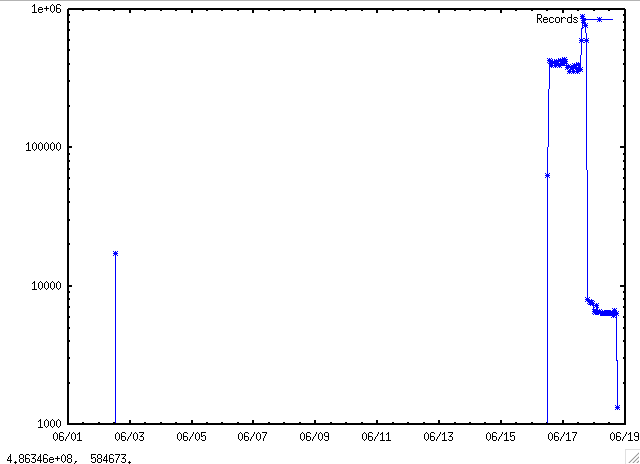
We now cover each of these commands in order:
gnuplot> set xdata time
gnuplot> set timefmt "%Y/%m/%dT%H:%M:%S"
This instructs Gnuplot to treat its x axis as time-ordered data. The next line specifies the format of the time data; the "%Y/%m/%dT%H:%M:%S" format will read normal rwcount dates correctly.
gnuplot> set logscale y
This sets the y axis to use a logarithmic rather than linear scale. Practically speaking, logarithmic scale plots reduce the effect of large outliers (such as those caused by scans and DDoSes) and let you see other traffic in a plot.
gnuplot> set yrange [1000:]
The yrange command tells Gnuplot what set of y values to plot; in the form given above ([1000:]), Gnuplot will plot everything that has a value of 1000 or more.
gnuplot> plot 'sample.txt' using 1:2 title 'Records' with linespoints 3
Note that in the new plot we specify what columns of the data file to use (using 1:2). Gnuplot will treat the date field from rwcount as a column, and then every other value (records,bytes,and packets) as additional columns. This instruction says to use the first column (dates) as the X values and the second column (records) as the Y values.
The title command specifies a title (in this case 'Records'). The end of the command (with linespoints 3) specifies to plot using a line with points and to set the color to blue (style 3). The resulting plot is the second plot shown above.
Gnuplot is a fully-featured graphics programming environment. You can learn more about Gnuplot using its built-in help facility. Just type gnuplot at the command line to enter interactive use, and type help to learn more. help plot will teach you specifically about the plot command.
