Grid lines
Grid lines add reference lines to the plotting area. A chart with grid lines is an example of a chart with grid lines:
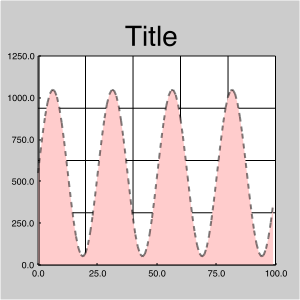
A chart with grid lines
Note that two sets of grid lines are used in this chart – one for the horizontal lines and one for the vertical lines.
Grid lines are actually special plots that draw lines perpendicular to its one spatial axis. Grid lines have the following axes:
| Axis | Value | Rendering | Default Scale |
|---|---|---|---|
| pos | A real number between 0 and 1 | Spatial position | No default |
| line_style | String | Style of line to use (equivalent to nicknames passed to the new_line method). | solid |
| line_width | Number | Width of line in points/pixels | 1 |
| line_color | A color specification (see Specifying Colors) | Color of line | #000000FF |
| ticksets | List | Tick sets to draw on the line | Empty list |
Grid lines are added to the chart via the add_front_gridlines and add_front_gridlines methods
Creating grid lines
The most straightforward way to create grid lines is via the new_gridlines method. The resulting grid lines require further configuration; at a minimum, the user must supply a scale (and probably data) for the pos axis. A minimal example:
vgrid = tools.new_gridlines(
    'vertical',
    pos_data=[10,20,30],
    pos_scale=tools.new_scale('linear'))
To customize the display of grid lines, supply different scales (or data) to the grid line’s axes:
vgrid = tools.new_gridlines(
    'vertical',
    pos_data=[10,20,30],
    pos_scale=tools.new_scale('linear'),
    line_style_scale="dashed",
    line_width_scale=5)
Creating grid lines from tick marks
It is common to put grid lines in regular positions along an axis, often the same places where tick marks are placed. In this case, it may be easier to create grid lines using new_gridlines_from_tick_tuples:
# ticks is a Rayon tick set
vgrid = tools.new_gridlines_from_tick_tuples(
    'vertical',
    scale=ticks.get_scale(),
    tick_tuples=iter(ticks))
Creating grid lines from a border
The new_gridlines_from_border method takes a tickable border and puts grid lines at the positions of a tickset associated with the border. This further simplifies a common case, where grid lines parallel tick marks on a border:
# b is a Rayon border
vgrid = tools.new_gridlines_from_border(
    'vertical', b)
Adding tick marks to grid lines
Grid lines can not only be created from tick marks; tick marks can also be associated with grid lines. The simplest way to associate tick sets is by specifying a constant scale to the ticksets axis. More than one tick set may be specified in this way, leading Rayon to draw multiple sets of tick marks on the same line:
# t1 and t2 are tick sets
vgrid = tools.new_gridlines(..., ticksets_scale=[t1, t2])
One drawback to this approach is that the same sets of ticks will be drawn on every line in the grid lines. To draw different ticks on different lines, we must specify data and a scale for the ticksets axis:
# col is a column with two elements
# t1 and t2 are tick sets.
vgrid = tools.new_gridlines(...,
    pos_data=col,
    ticksets_data = [t1, t2],
    ticksets_scale = lambda x: x)
In the above example, the scale merely passes the data through without transformation. It is easy to conceive of more complicated scales. For instance, the following returns an empty list (no tick sets) if the tickset data is None:
def ticksetscale(x):
    if x is None: return []
    return x
horizontal
- toolbox.new_gridlines('horizontal'[, ...])
- toolbox.new_gridlines_from_border('horizontal', border[, tickset_idx=0, ...])
- toolbox.new_gridlines_from_tick_tuples('horizontal', scale, tick_tuples[, ...])
Draws horizontal lines across the plotting area.
Axes Axis Value Rendering Default Scale pos A real number between 0 and 1 Spatial position on the Y (vertical) axis No default line_style String Style of line to use (equivalent to nicknames passed to the new_line method.) solid line_width Number Width of line in points/pixels 1 line_color A color specification (see Specifying Colors) Color of line #000000FF ticksets List Tick sets to draw on the line Empty list
vertical
- toolbox.new_gridlines('vertical'[, ...])
- toolbox.new_gridlines_from_border('vertical', border[, tickset_idx=0, ...])
- toolbox.new_gridlines_from_tick_tuples('vertical', scale, tick_tuples[, ...])
Draws vertical lines across the plotting area.
Axes Axis Value Rendering Default Scale pos A real number between 0 and 1 Spatial position on the X (vertical) axis No default line_style String Style of line to use (equivalent to nicknames passed to the new_line method.) solid line_width Number Width of line in points/pixels 1 line_color A color specification (see Specifying Colors) Color of line #000000FF ticksets List Tick sets to draw on the line Empty list
